
Talking Points:
- Closing Out EUR/USD Shorts
- Wave 4 Correction, Wave 5 Drop in AUD/USD
- How to Locate the Ideal Entry Point
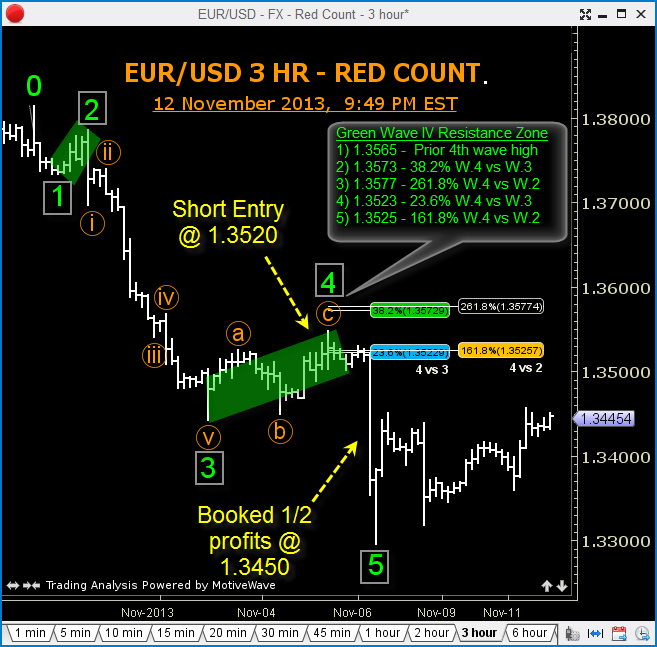
In last week’s article, we set up short trades in EURUSD. Our initial take profit was triggered following the reaction to the European Central Bank (ECB) announcement. At this point, I recommend either adjusting the stop loss on that trade to breakeven, or closing out the position entirely.
See recent: The Triple Bottom Trap and How to Dodge it
 EUR/USD: 3 Hour" title="EUR/USD: 3 Hour" height="undefined" width="undefined">
Looking back at the EURUSD set-up, you might notice that it was a fourth-wave correction within a five-wave Elliott trend. To review, a typical Elliott trend consists of five total waves, three trend waves and two corrective waves.
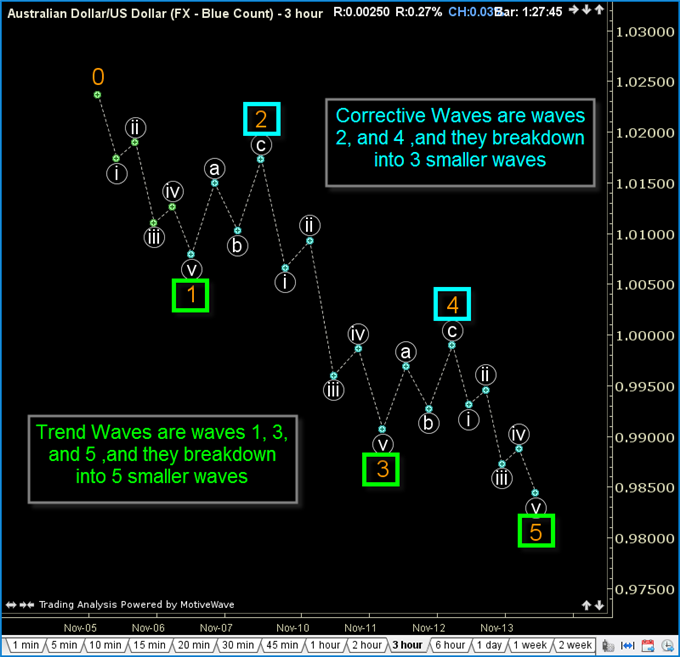
On the AUDUSD chart below, waves one, three, and five are the trend waves labeled with green boxes. Notice that they sub-divide into five smaller waves. The corrective waves (waves two and four) are labeled with teal blue boxes. These waves typically sub-divide into three smaller waves.
 AUD/USD: 3 Hour" title="AUD/USD: 3 Hour" height="undefined" width="undefined">
The Pros and Cons of Trading Fourth Waves
We often trade the completion of a fourth-wave correction in order to position for a fifth-wave ride to new lows. There are pros and cons of trading the completion of fourth waves, however.
One positive of trading fourth waves is because waves one through three of the Elliott trend have already unfolded, you can be confident of your location in the Elliott trend and more certain that a final wave-five move is coming.
A negative aspect is that there is often limited price movement in the fifth and final wave, so you must be in and out of your trade fairly quickly and never become complacent in the trade.
The AUD/USD Move Setting up Now
Today’s AUDUSD set-up is actually very similar to the EURUSD trade from last week. In the prior trade strategy, we cautioned against shorting a breakdown of a highly visible and elementary technical support, which, in the case of EURUSD, was 1.3470.
Instead, we recommended waiting for a corrective bounce from that highly visible technical support level and move into shorts, which we viewed as a fourth-wave correction.
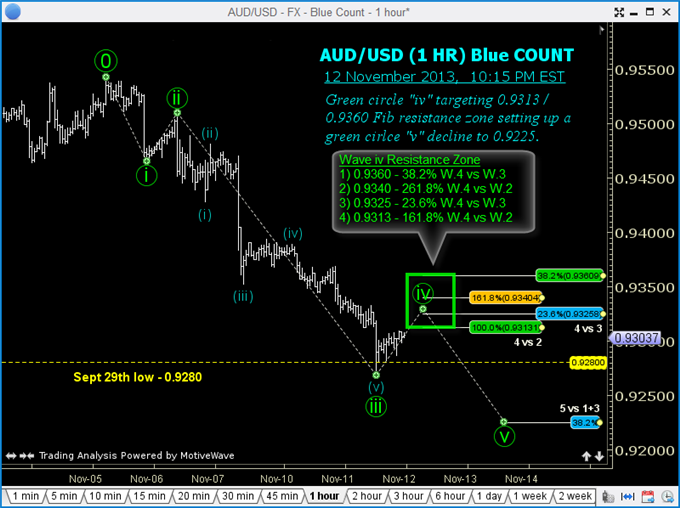
Currently, AUDUSD is in a very similar position with an ongoing test of the September 29 low of 0.9280. So far, that key support level has held, and the pair is rallying in what we believe to be a fourth wave. This, like all fourth waves, is a corrective wave, which means we are expecting a wave-five slide to new lows in AUDUSD.
Guest Commentary: AUD/USD Wave 4 Correction, Wave 5 Drop
 AUD/USD Wave 4 Correction, Wave 5 Drop" title="AUD/USD Wave 4 Correction, Wave 5 Drop" height="undefined" width="undefined">
The secret to calculating the end of fourth-wave corrections is to use Fibonacci analysis of the prior known waves to project the end of the current wave. So far, we know the distance traveled in waves one, two, and three, and we know that wave four is ongoing.
Here is the action plan, as shown on the AUDUSD chart above:
- Use your Fibonacci projection tool to measure the known distance of same-degree green wave “ii.” Then, click a third time at the start of green wave “iv” and your Fibonacci levels will appear as upside targets on the chart. This analysis is labeled as “4 vs. 2” on the chart above.
- Use your Fibonacci retracement tool to measure the distance of same-degree green wave “iv.” Unlike a Fibonacci projection tool, a retracement tool only requires two clicks. Your common Fibonacci ratios (which we will discuss in future articles) will appear alongside the Fibonacci projections just calculated. You are now forming a zone of resistance that should capture the end of green wave “iv.” This analysis is labeled as “4 vs. 3” on the above chart.
The trade is to sell half a position at the lower end of the Fib zone at 0.9320, sell another half position at the upper end of the Fib zone at 0.9350, and place a stop loss for the entire position above the Fib zone at 0.9405. The initial take-profit is the blue “5 vs. 1+3” level at 0.9225, which represents a concept we will also discuss further in future articles.
Elliott wave can be tricky to grasp when starting out and “surfing the waves,” but allow me to leave you with a pair of quotes. The first is from my trading idol, Paul Tudor Jones, in the widely popular, must-read book Market Wizards:
“… Elliott Wave Theory allows one to create incredibly favorable risk/reward opportunities. That is the same reason I attribute a lot of my own success to the Elliott Wave approach.“ –Paul Tudor Jones, Market Wizards
The second is from a friend and colleague with over three decades experience as a technical analyst for major investment banks:
"The Wave Principle is a simple rule-based methodology (3 rules) that allows the practitioner to dissect the collective ‘mindset’ of the market’s participants, which allows for defined, attractive/positive risk-reward trading/investing parameters--A game plan." --Andrew Baptiste, Chief Technical Analyst, Morgan Stanley (1999-2011)
Personally, I have relied almost exclusively on Elliott Wave theory to trade for a hedge fund, set up trades for clients, and also trade my personal accounts.
By Todd Gordon, founder, TradingAnalysis.com