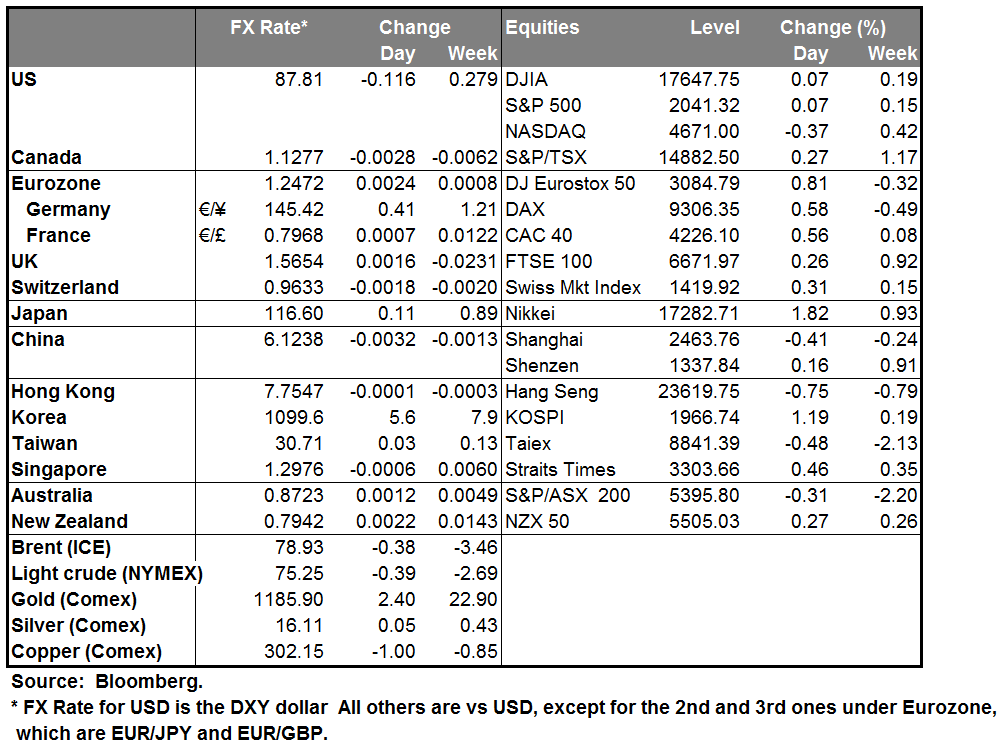
Policy divergence intensifies The dollar recovered generally against most of its G10 counterparts on Monday after falling precipitously on Friday. Much of the movement seems to have been mean reversion. For example, NZD and AUD were the best performing currencies on Friday, but they were the worst performing currencies during the European day yesterday.
FX seems to be in the spotlight nowadays. The wild movements in our market – EUR/USD traded in a 1.1% range yesterday while USD/JPY had a 1.4% range – are in sharp contrast to the US stock market, which once again closed with less than 0.1% change on the day. The bond market is somewhere in between: 10-year yields yesterday rose from 2.28% to a high of 2.35% as the Empire State manufacturing survey rose (although was below expectations).
The rise in US yields was somewhat puzzling in light of a San Francisco Fed paper released yesterday that argued “the risk of high inflation in the next one to two years remains very low by historical standards.” The risks “remain tilted to the downside,” it said, adding that “monetary policy is not contributing to the risk of inflation being above the median projection in the near future.” This is an important contribution to the policy debate as it gives academic backing to those who want to delay a rate hike. The Fed funds futures clearly reflected the paper’s conclusion: implied interest rates on the near Fed funds contracts (the next one to two years) fell 2 bps, but implied rates on the far contracts rose by 2 bps.
Given the (slightly) reduced outlook for near-term tightening in the US, the dollar’s strength may be more a result of “process of elimination” investing than anything else. With Japan slipping back into recession, there’s little if any chance of that country cutting back its quantitative easing program any time soon. Meanwhile, two ECB officials yesterday showed the Bank’s strong resolve to do “whatever it takes” to get the Eurozone economy moving again. ECB Executive Board member Yves Mersch , a noted policy hawk, gave a speech devoted to asset purchases. He said the central bank could theoretically extend purchases to gold, shares, or exchange traded funds (ETFs) or other assets if more action is needed, although he focused on the prospects for buying sovereign bonds. This speech was significant as it was the first time one of the ECB hawks has given such a detailed discussion of the possibilities for QE. Then ECB President Mario Draghi said the central bank is ready for further stimulus if its current efforts are not sufficient to accelerate the region’s recovery. Not only could they increase asset purchases, but they could also alter the size of the targeted long-term refinancing operations if necessary to meet their balance sheet target. Also he linked the “new measures” being investigated to asset purchases, again implying a larger balance sheet. Net net, it’s clear that the ECB is rapidly losing its aversion to extraordinary measures just as the US is embarking on a normalization of policy. The divergence in monetary policy between the US and other countries, notably Japan and the Eurozone, is likely to be a driver of the FX market for a considerable length of time, in my view.
Today’s schedule: The Reserve Bank of Australia released the minutes from its November policy meeting. They were slightly more dovish, with a little less optimism about the growth outlook. There was no change in their comments about the AUD however and the currency was largely unaffected.
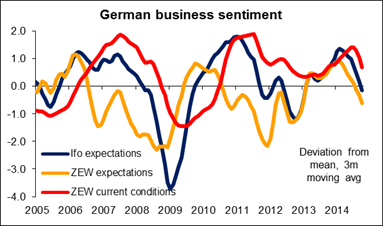
During the European day, the highlights will be the UK CPI for October and the German ZEW survey for November. The UK CPI rate is expected to have remained unchanged at +1.2% yoy. That could push further back the expectations for BoE tightening and could leave sterling under selling pressure. In Germany, the ZEW current situation index is expected to have declined, but the expectations index is estimated to have turned positive. The low levels of the indices will confirm once again that Eurozone’s growth engine is still facing problems, although the improvement in the expectations index could be EUR-positive.
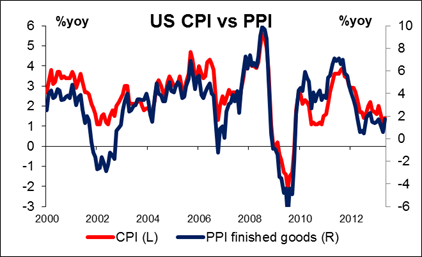
In the US, both the headline and the core (excluding food and energy) PPI rates are forecast to have declined in October, corroborating the San Francisco Fed’s view on inflation. That could be negative for USD. The NAHB housing market index for November is forecast increase by one unit.
We have four speakers on Tuesday’s agenda: Reserve Bank of Australia Governor Glenn Stevens, ECB governing council member Klaas Knot, Minneapolis Fed President Narayana Kocherlakota and BoE MPC member Kristin Forbes.
The Market
EUR/USD tumbles after Draghi’s comments
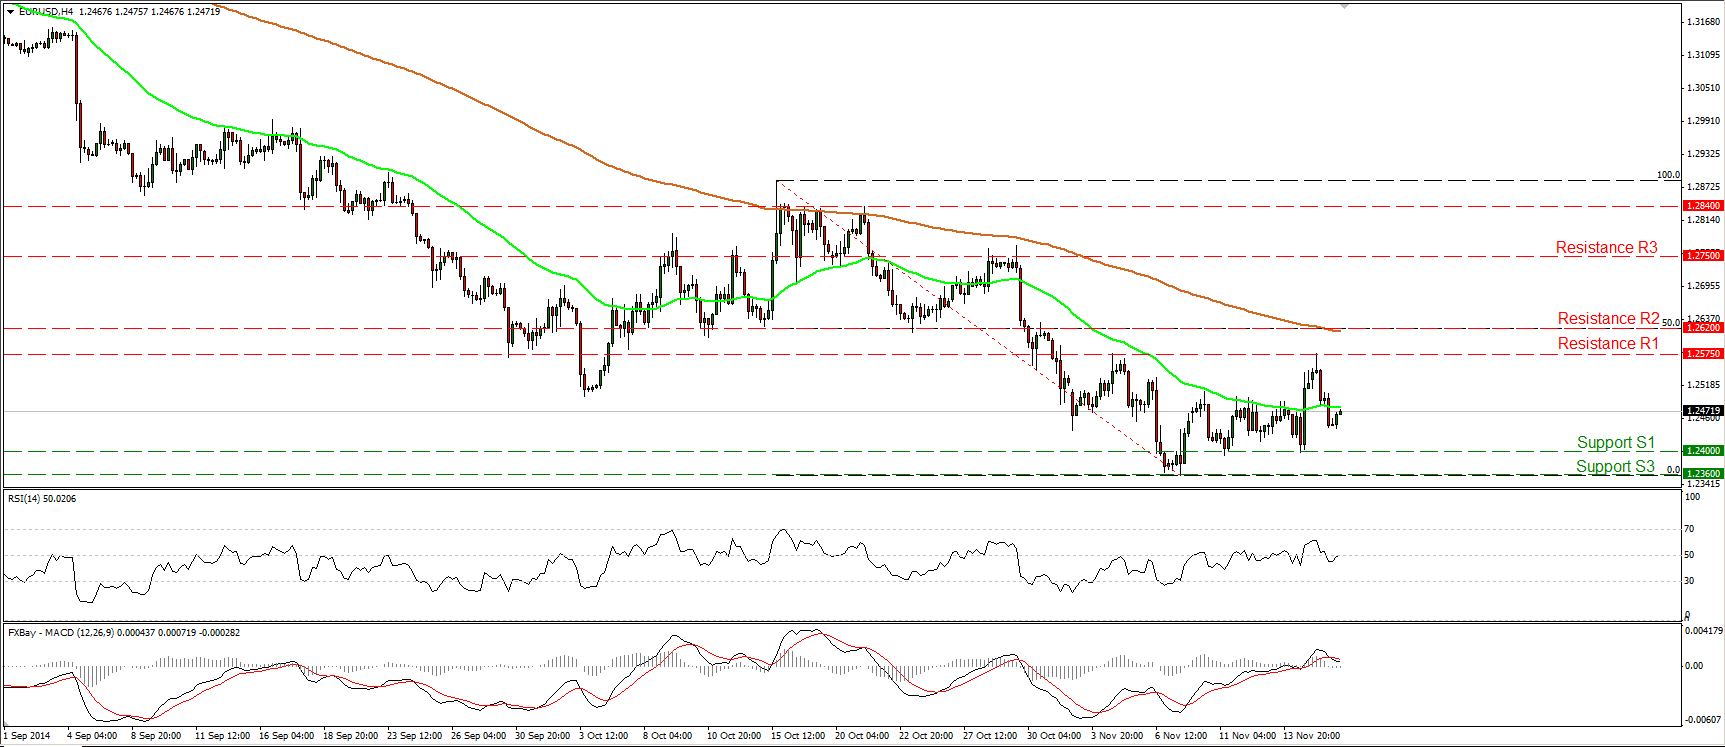
EUR/USD tumbled on Monday after the ECB President said that the Bank is ready to provide additional stimulus if needed and that such new measures could include purchases of sovereign bonds. The pair declined after finding resistance at 1.2575 (R1), a level marked by the high of the 4th of November, but the fall was stopped 40 pips above our support line of 1.2400 (S1). In the bigger picture, the price structure on the daily chart still suggests a downtrend, but there is still positive divergence between both of our daily momentum studies and the price action, which indicates decelerating negative momentum. Thus I would prefer to stay flat for now and wait for more actionable signs to convince me that the downtrend is back in force and likely to continue.
• Support: 1.2400 (S1), 1.2360 (S2), 1.2250 (S3)
• Resistance: 1.2575 (R1), 1.2620 (R2), 1.2750 (R3)
GBP/JPY within a short-term range
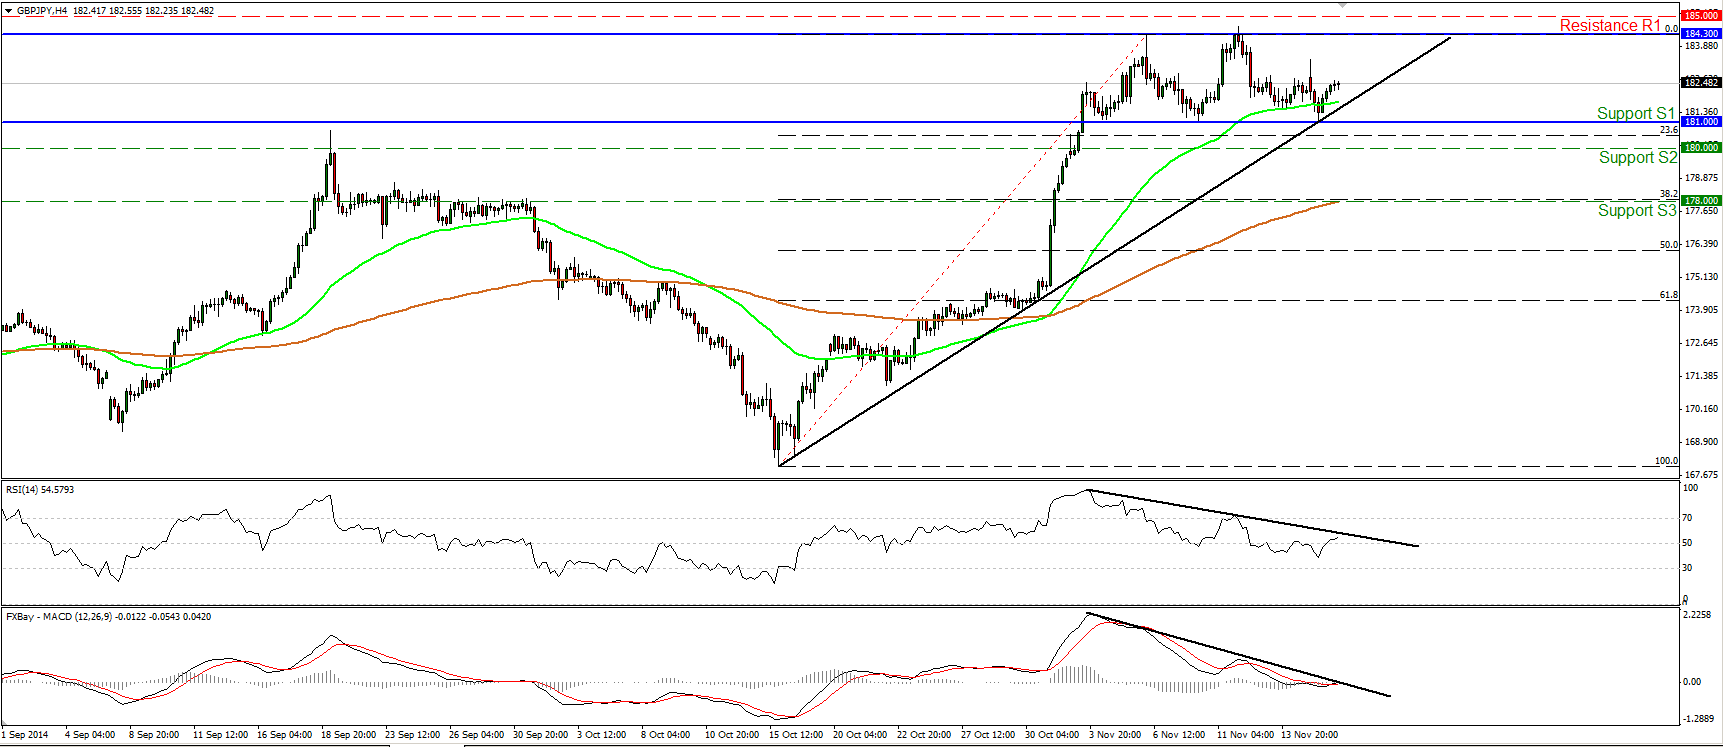
GBP/JPY moved higher on Monday after finding support at 181.00 (S1), the lower bound of the sideways path it’s been trading in since the beginning of the month. Although the rate remains above the black uptrend line (drawn from back at the low of the 15th of October) and above both the 50- and the 200-period moving averages, bearing in mind that the pair has been oscillating between 181.00 (S1) and 184.30 (R1) I would prefer to adopt a “wait and see” approach for now. Moreover, I can spot negative divergence between both our short-term momentum studies and the price action, which supports my choice to remain neutral for now. I would prefer to see a clear move above the key zone of 185.00 (R2) before getting confident again on the upside. On the other hand, a break below the psychological area of 180.00 (S2) is the move that could flip the short-term bias to the downside and perhaps trigger extensions towards 178.00 (S3), which happens to lie fractionally close to the 38.2% retracement level of the 15th October – 6th November rally.
• Support: 181.00 (S1), 180.00 (S2), 178.00 (S3)
• Resistance: 184.30 (R1), 185.00 (R2), 188.00 (R3)
AUD/USD within a short-term upside channel
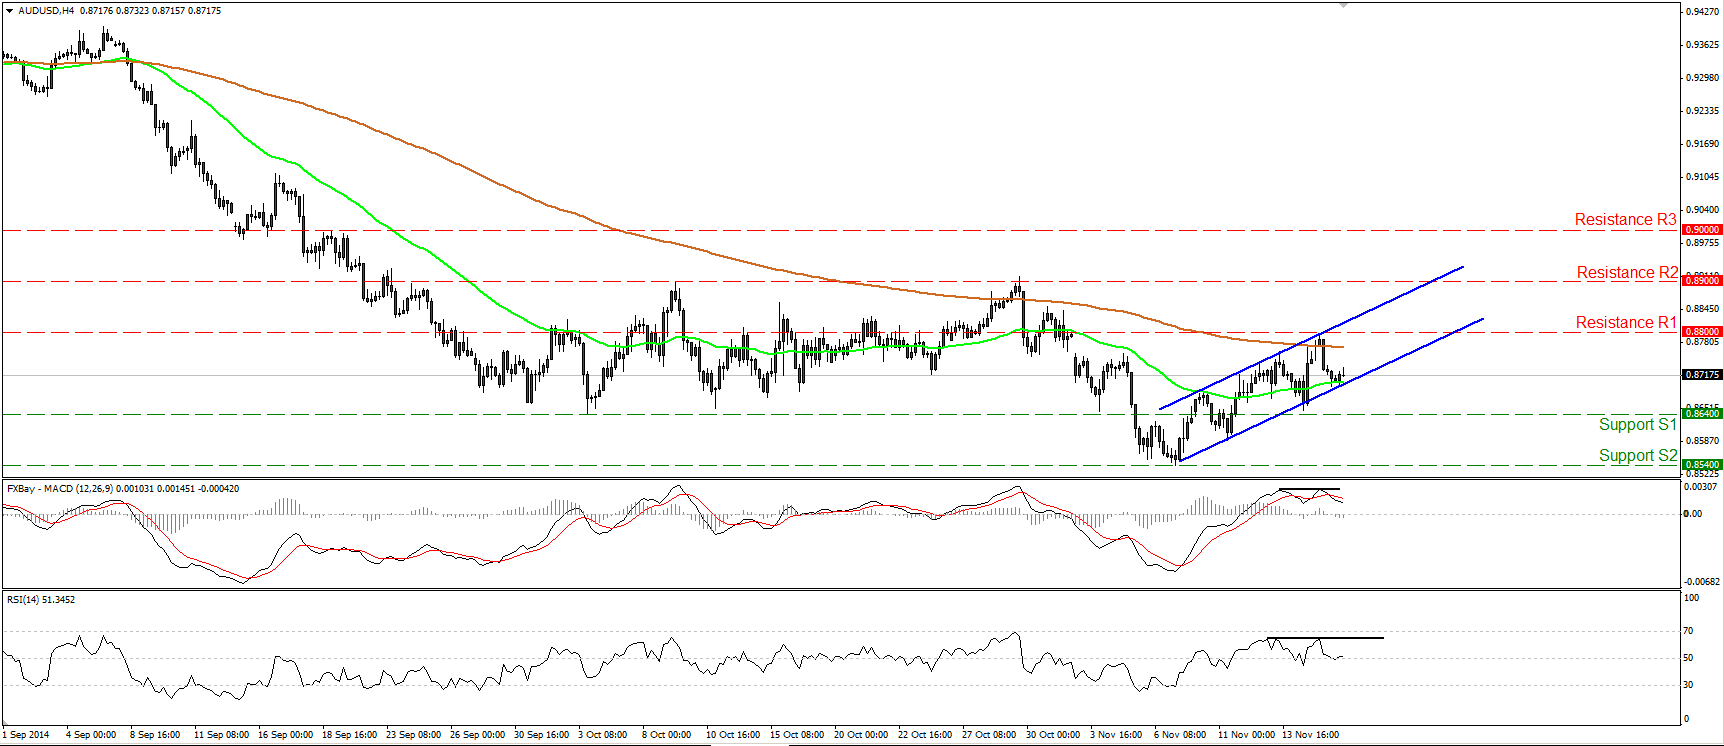
AUD/USD slid yesterday, but the decline was stopped by the lower bound of the blue short-term upside channel. The fact that the rate remains within the channel shows that the short-term path of the pair, at least for now, is to the upside. Nonetheless, taking a close look at our momentum studies, I would trust this path only if a clear move above 0.8800 (R1) occurs. Such a break is likely to see scope for extensions towards our next resistance obstacle at 0.8900 (R2). On the daily chart, since the rate remains below both the 50- and 200- day moving averages, I still see a longer-term downtrend and I believe that the recovery from 0.8540 (S2) still has a corrective structure for the time being.
• Support: 0.8640 (S1), 0.8540 (S2), 0.8500 (S3)
• Resistance: 0.8800 (R1), 0.8900 (R2), 0.9000 (R3)
Gold moves in a consolidative manner
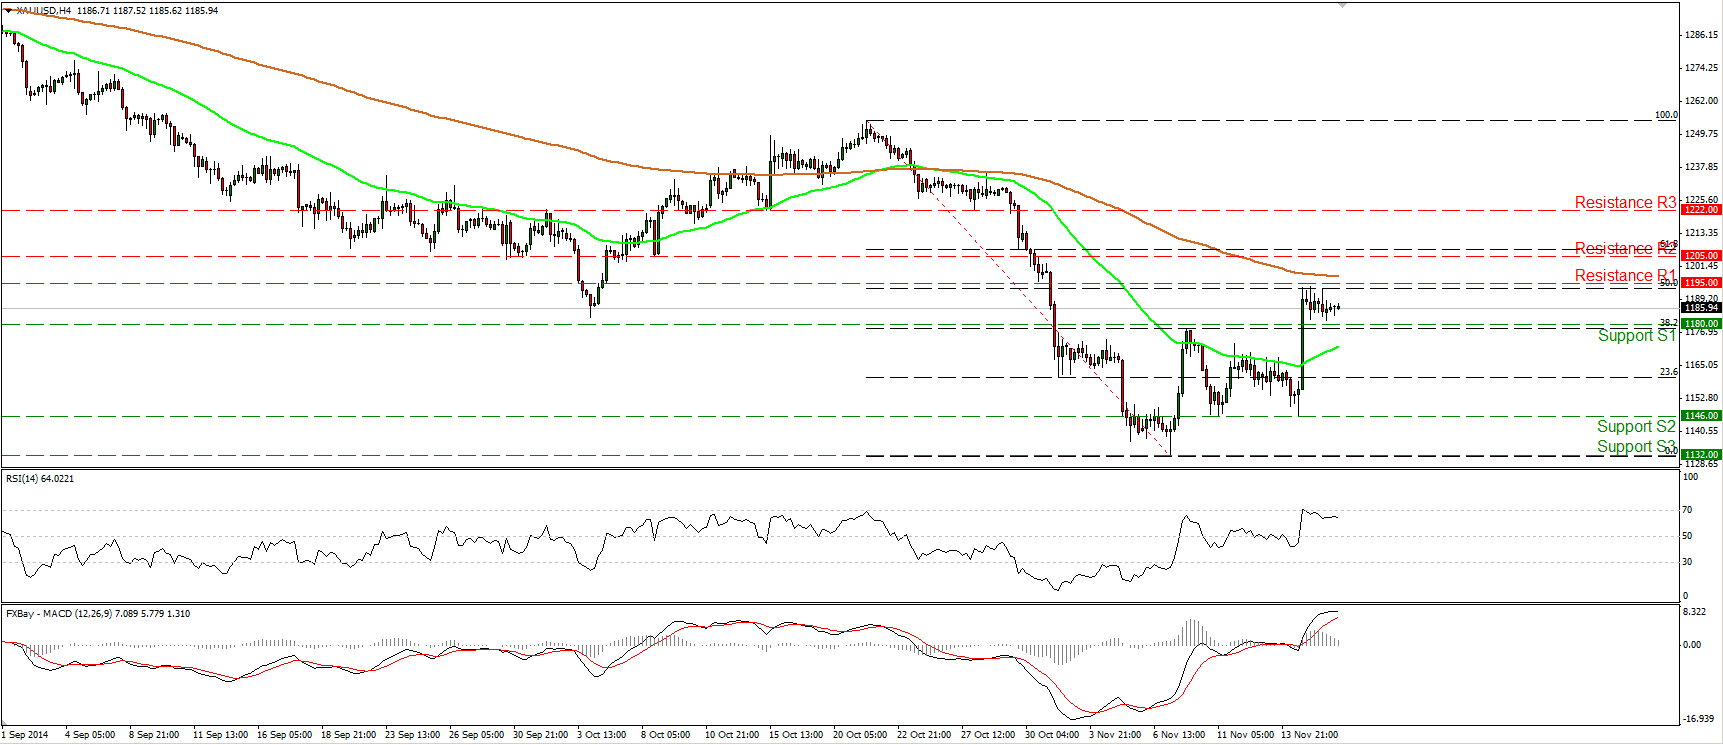
Gold moved in a consolidative mode on Monday, staying between the support of 1180 (S1) and the 1195 (R1) resistance, which is marginally above the 50% retracement level of the 21st October – 7th of November down wave. I will repeat that Friday’s move above1180 (S1) confirms a higher high on the 4-hour chart. This fact, alongside our momentum signals, makes me believe that we may experience further upside in the near future. On the daily chart, the 14-day RSI remains near its 50 line, while the daily MACD stands above its trigger and is pointing north. A clear move above 1195 (R1) is likely to target the next resistance at 1205 (R2), which lies slightly below the 61.8% retracement level of the aforementioned decline. However, regarding the broader trend, I still see a longer-term downtrend. Hence, on the absence of any major bullish trend reversal signal, I would prefer to adopt a “wait and see” stance as far as the overall outlook of the yellow metal is concerned.
• Support: 1180 (S1), 1146 (S2), 1132 (S3)
• Resistance: 1195 (R1), 1205 (R2), 1222 (R3)
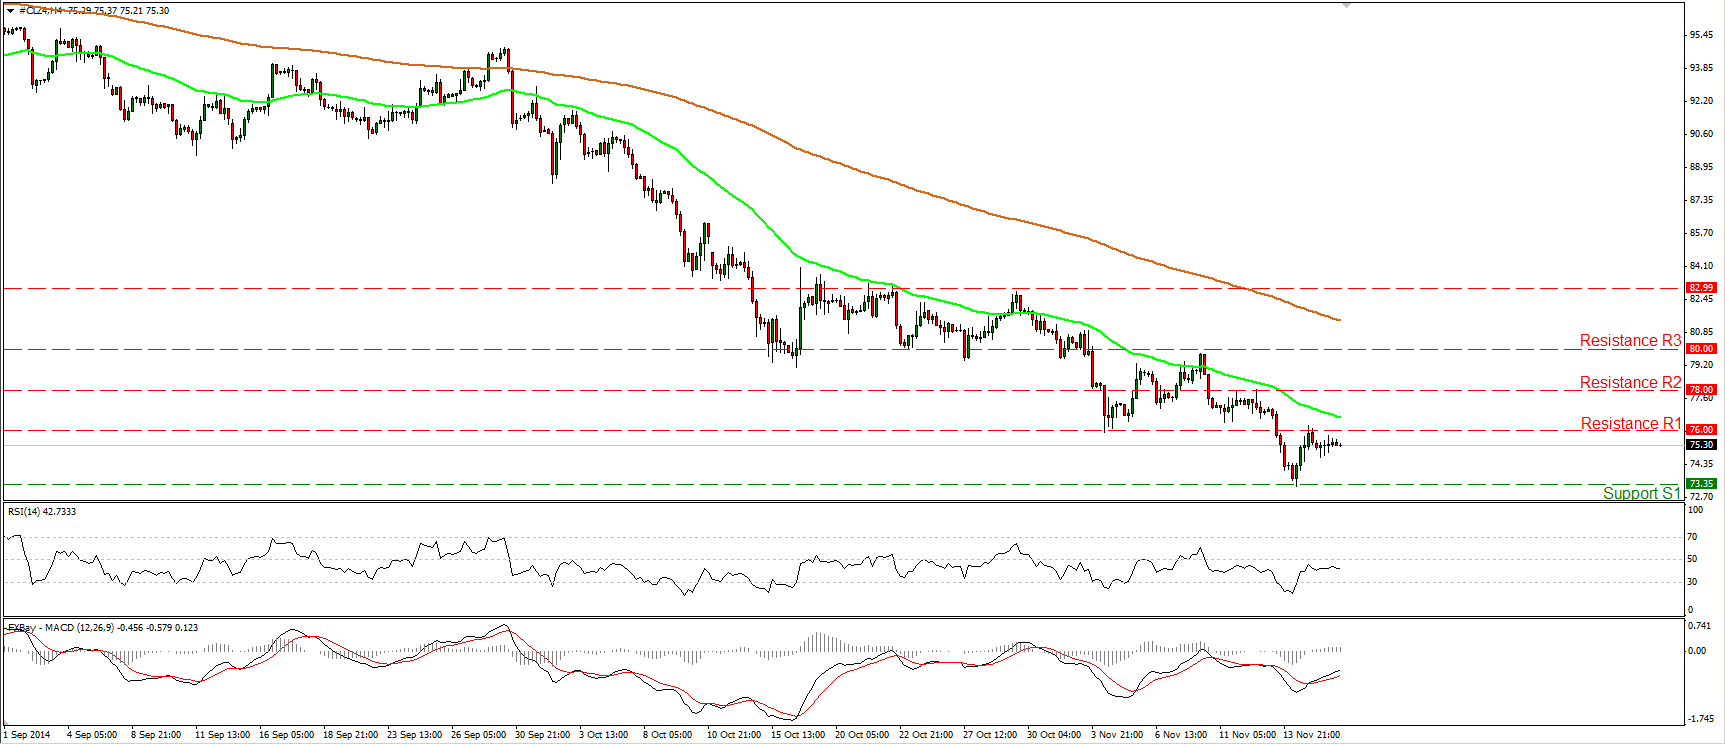
WTI stays below 76.00
WTI moved quietly yesterday, staying slightly below the 76.00 (R1) resistance line. On the daily chart the price structure remains lower peaks and lower troughs below both the 50- and the 200-day moving averages, thus I still see a negative overall bias. Consequently, I would expect Friday’s rebound or any possible short-term extensions of it to provide renewed selling opportunities. A clear and decisive dip below the 73.35 (S1) obstacle would signal a forthcoming lower low and perhaps see scope for extensions towards our next support at 71.00 (S2), defined by the lows of July and August 2010.
• Support: 73.35 (S1), 71.00 (S2), 70.00 (S3)
• Resistance: 76.00 (R1), 78.00 (R2), 80.00 (R3)

