This past weekend I made a note that there is finally a coal chart that I could start to like, Arch Coal (ACI). What seems to have been missed is the caveats that came with my future approval. Let me explain in more detail.
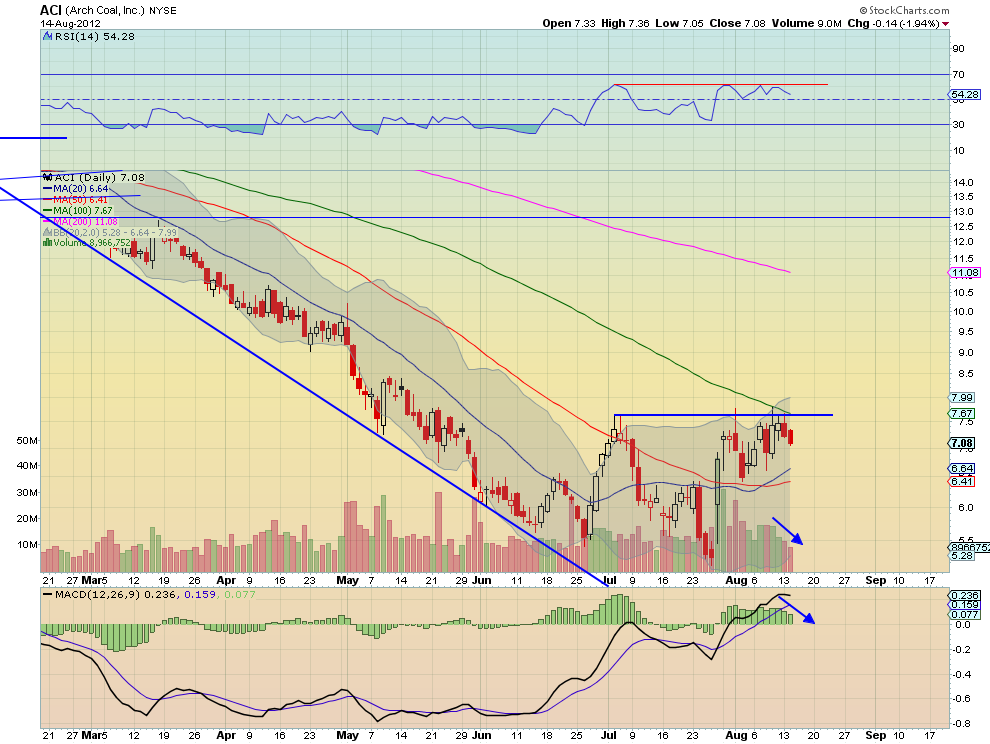
The daily chart below shows a bottoming formation, nothing more. The price has stopped falling and is moving sideways. It has a Relative Strength Index (RSI) that has continued to stall at 60 and a Moving Average Convergence Divergence indicator (MACD) that has been running flat and is now starting to fade. Consolidation at best on this time frame, with the possibility of a minor double top at the falling 100-day Simple Moving Average (SMA).
Arch Coal (ACI) Daily
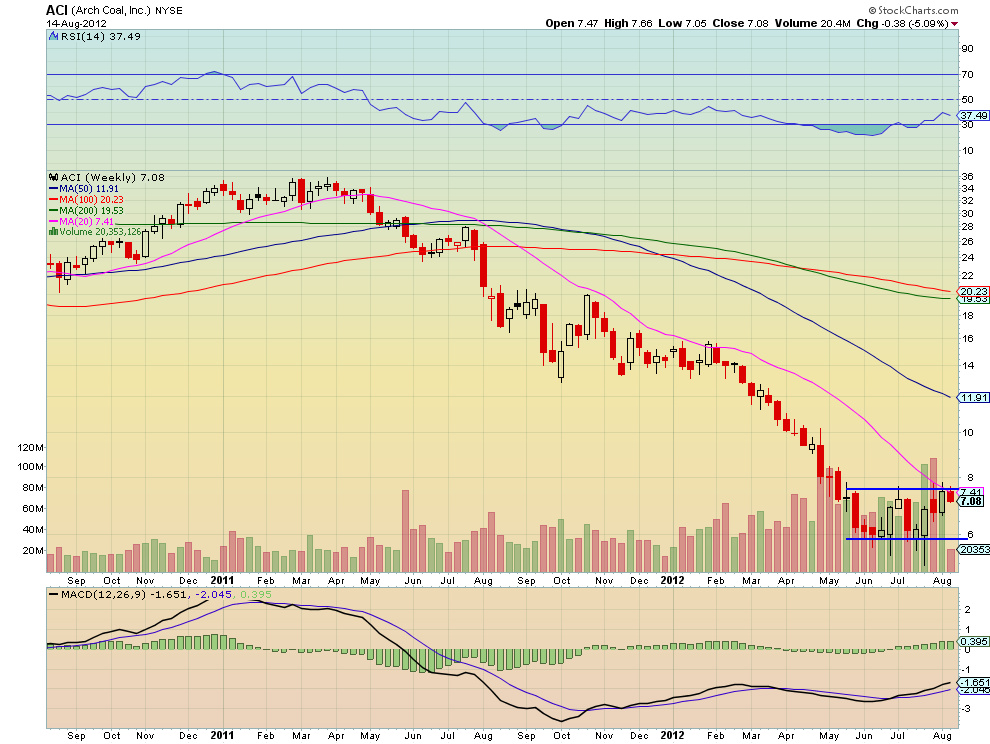
It will take a move over 7.70, a higher high to start a bullish watch. The weekly picture puts it into perspective. The channel between 5.80 and 7.70 shows a MACD that is trying to move higher and a RSI that is slowly trending up, but the MACD is still very near zero and the RSI is not yet over 40 and starting to roll lower.
Arch Coal (ACI) Weekly
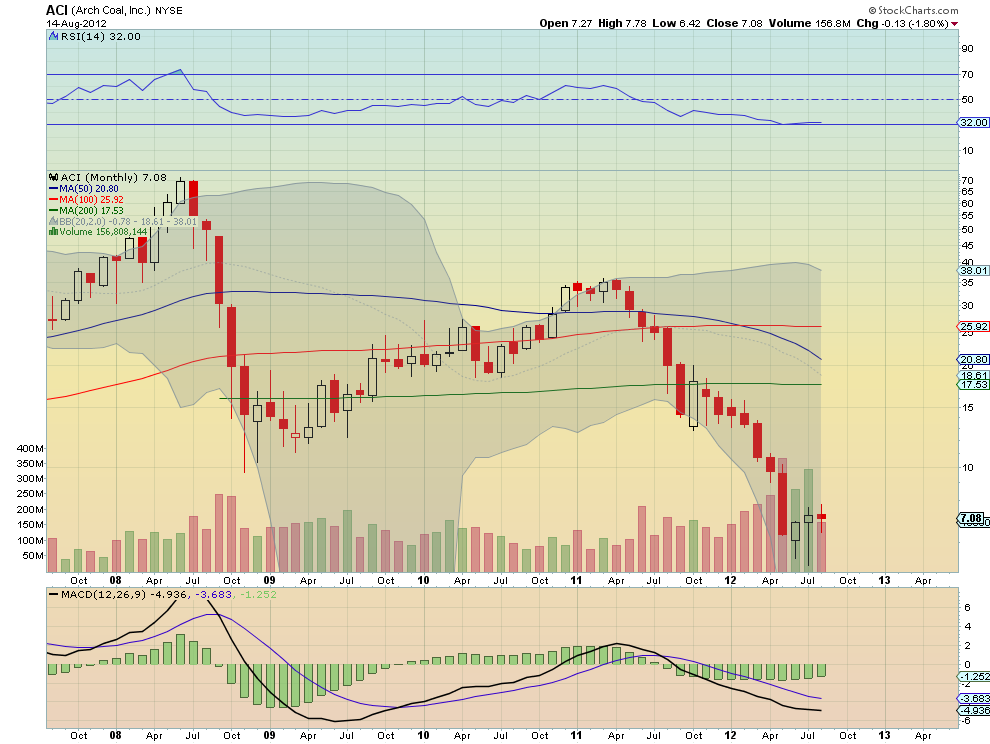
Nothing bullish here, move along. Finally, the monthly view is showing nothing more than a bear flag with a RSI that is running along the oversold line but not extreme and a MACD that is negative and slowly going nowhere.
Go ahead and put your money in this name if you have some fundamental reason. Frankly with a slowing world economy I am not sure what that could be. But from a technical perspective, this stock is treading water and has not shown that it will even survive. With the broad market looking much better, I will pass.
Arch Coal (ACI) Monthly
Disclaimer: The information in this blog post represents my own opinions and does not contain a recommendation for any particular security or investment. I or my affiliates may hold positions or other interests in securities mentioned in the Blog, please see my Disclaimer page for my full disclaimer.
Original post
- English (UK)
- English (India)
- English (Canada)
- English (Australia)
- English (South Africa)
- English (Philippines)
- English (Nigeria)
- Deutsch
- Español (España)
- Español (México)
- Français
- Italiano
- Nederlands
- Português (Portugal)
- Polski
- Português (Brasil)
- Русский
- Türkçe
- العربية
- Ελληνικά
- Svenska
- Suomi
- עברית
- 日本語
- 한국어
- 简体中文
- 繁體中文
- Bahasa Indonesia
- Bahasa Melayu
- ไทย
- Tiếng Việt
- हिंदी
Arch Coal Is Just The Best Of A Bad Group
Published 08/15/2012, 03:10 AM
Updated 05/14/2017, 06:45 AM
Arch Coal Is Just The Best Of A Bad Group
Latest comments
Loading next article…
Install Our App
Risk Disclosure: Trading in financial instruments and/or cryptocurrencies involves high risks including the risk of losing some, or all, of your investment amount, and may not be suitable for all investors. Prices of cryptocurrencies are extremely volatile and may be affected by external factors such as financial, regulatory or political events. Trading on margin increases the financial risks.
Before deciding to trade in financial instrument or cryptocurrencies you should be fully informed of the risks and costs associated with trading the financial markets, carefully consider your investment objectives, level of experience, and risk appetite, and seek professional advice where needed.
Fusion Media would like to remind you that the data contained in this website is not necessarily real-time nor accurate. The data and prices on the website are not necessarily provided by any market or exchange, but may be provided by market makers, and so prices may not be accurate and may differ from the actual price at any given market, meaning prices are indicative and not appropriate for trading purposes. Fusion Media and any provider of the data contained in this website will not accept liability for any loss or damage as a result of your trading, or your reliance on the information contained within this website.
It is prohibited to use, store, reproduce, display, modify, transmit or distribute the data contained in this website without the explicit prior written permission of Fusion Media and/or the data provider. All intellectual property rights are reserved by the providers and/or the exchange providing the data contained in this website.
Fusion Media may be compensated by the advertisers that appear on the website, based on your interaction with the advertisements or advertisers.
© 2007-2024 - Fusion Media Limited. All Rights Reserved.
