
Apple Inc. (AAPL) blew straight through the support trendline from early 2009 at the open yesterday and is now very close to testing weekly (LOG) rising channel support from 2003. This is AAPL's primary support trendline and a break below it would be a major technical break. Now that AAPL is close to that line I am refining the target to 440 plus or minus five. If we see this trendline break I then have the next major support level around 360 and it's worth mentioning here that a percentage decline of that magnitude (to 360) from the 2012 high would be in line with the declines in both 2006 and 2008: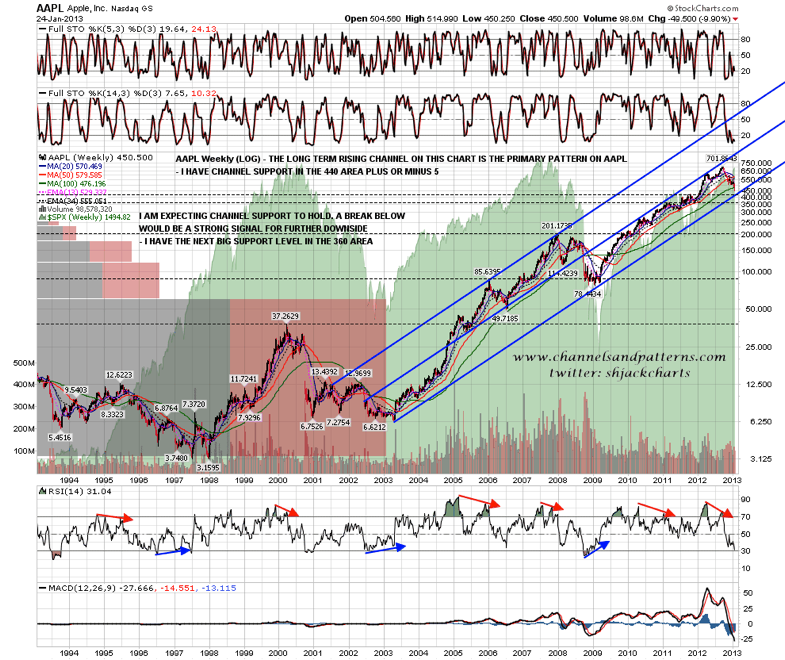
ES is still making higher highs and lows, and the 50-hour moving average is primary support. That's now in the 1488.5 area and if we should see a break below yesterday's low at 1486.25 this chart would start to look interesting on the short side: 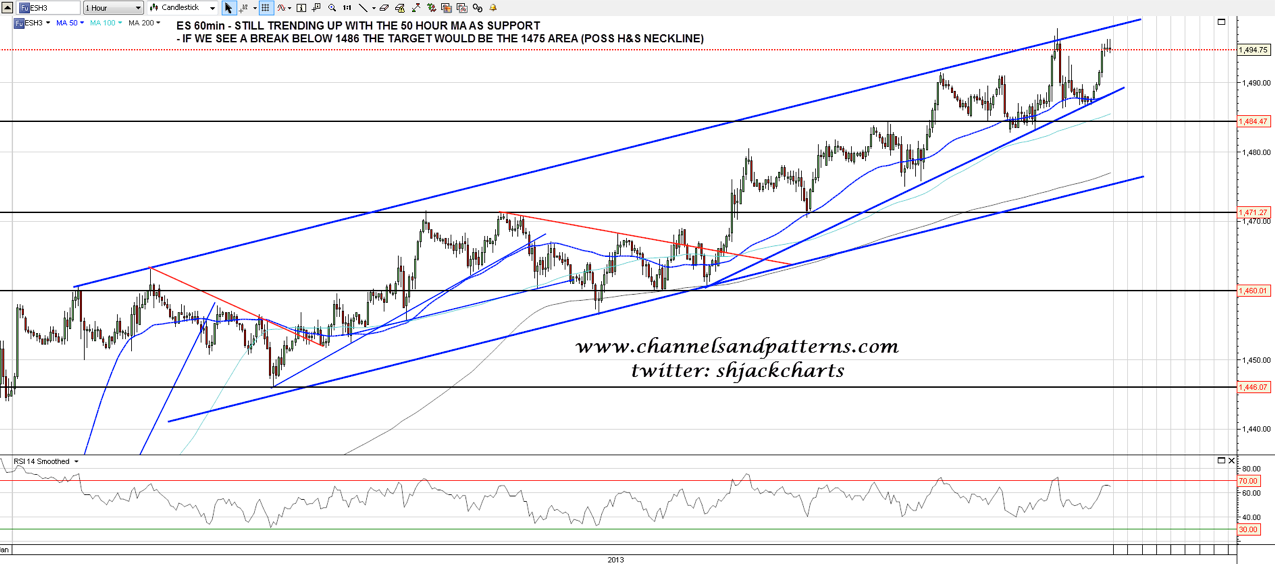
On the SPX weekly chart I have upper bollinger band resistance in the 1501.5 area. I'm not expecting a close much above that today. This is the fourth week of SPX pushing up under the weekly upper bollinger band, and in terms of past moves on the seven-year chart below, a median move like this would run six to eight weeks before reversing to test the middle BB. This move is therefore not extended in historical terms, though everything is now overbought on the daily RSIs of course: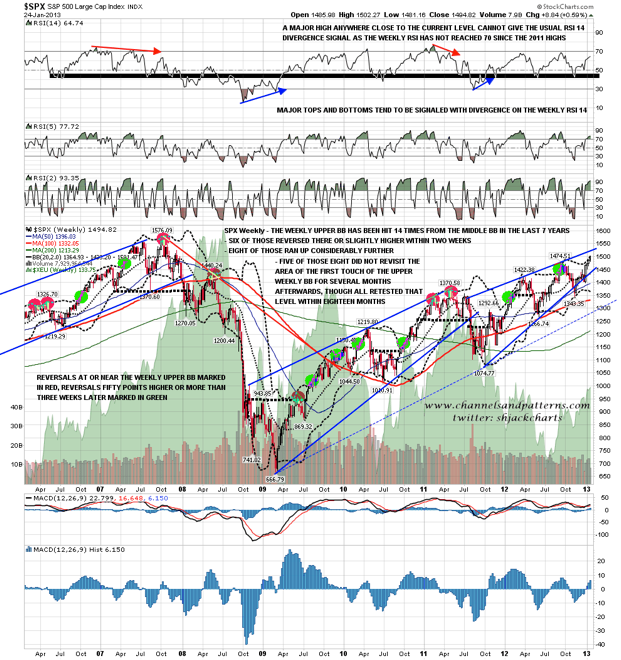
I've looked often at the possible rising wedge / double top setup on the SPX and Dow charts, and I've been sounding increasingly doubtful about these as this bull run on equities has continued, even though we are now in my ideal target zone for both for the second high. Why is that? Simply because of the nature of the move up this month. I expressed doubts about these setups in December because the weekly RSIs are not at a level where any normal major top signal could be seen, and that was a strike against this setup from the beginning.
What could have strengthened this setup considerably would have been rising wedges forming on SPX and Dow from the November lows, but we haven't seen that. What we are seeing is moves up that at this stage have no well defined support trendlines or overall pattern. What this generally means is that it is too early in the trend for these to be clear, and that is not bearish at all. If these rising wedges / double-tops are to play out, I would expect to see a major high on SPX in the 1500-20 area. If we don't see that then the obvious target area is a test of the 2007 highs and if we are to see the next bull market top develop with the sort of weekly RSI signal that you can see on the chart above at the 2007 and 2011 highs, possibly considerably higher than the 2007 high. Here's the updated rising wedge setup on the Dow daily chart and you can see that the daily RSI 14 has now just edged into overbought territory: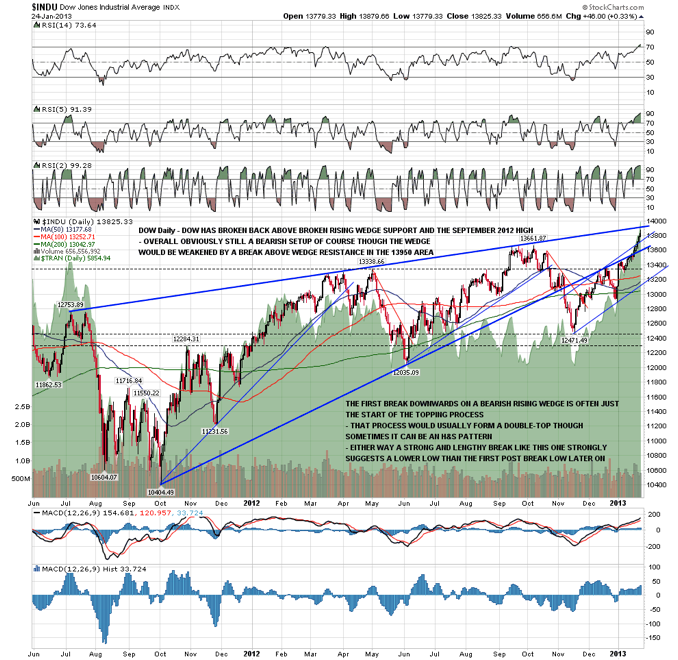
NDX is the weakest index here, obviously because of AAPL. There is a possible rising wedge developing there from the November low but in the absence of supporting patterns on Dow, SPX, RUT and TRAN my confidence in this isn't high. A move to test wedge support would strengthen this setup considerably though.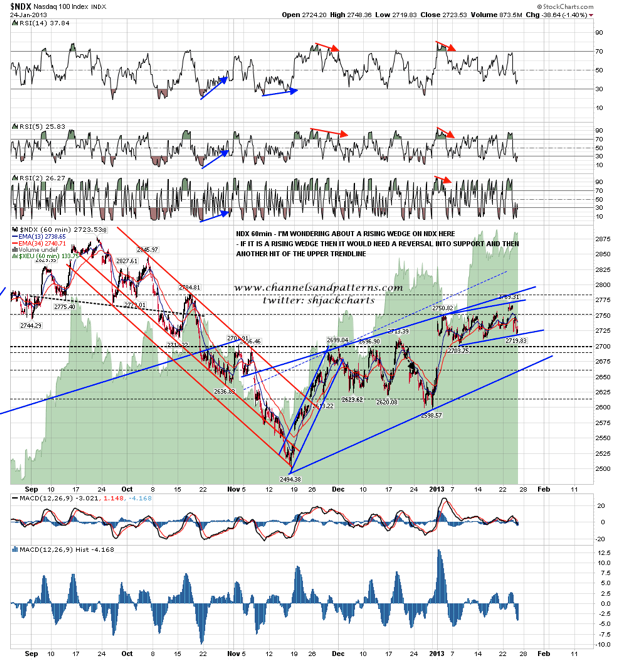
EURUSD has broken up from the triangle I was looking at yesterday and is on the way to test the next major level at 1.35. On a break above I have the next trendline resistance in the 1.38 area. I'll be looking more at this next week as EURUSD is giving a very misleading impression here that USD is weakening fast, whereas in fact USD has been strengthening against Yen, GBP, AUD and CAD. The uptrend on EURUSD still looks good here though: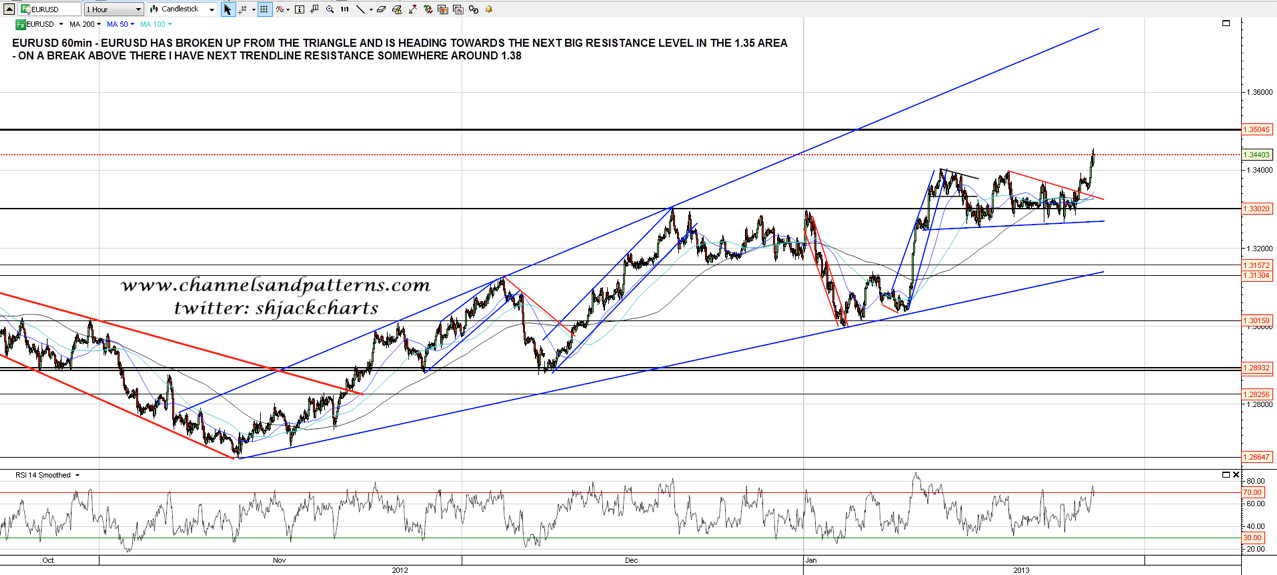 EUR/USD: 60 Minute" width="1277" height="575">
The last two chart today are updates on plays that I have posted before. The first is Yen (JPYUSD). Since I posted this very bearish chart in late November at the 126 level Yen has been collapsing against USD. it is now very oversold on the weekly RSI and there is serious talk of a bounce here. If we see that the bounce would target resistance in the 114.5 to 116 area and should be sold down to the H&S target and decent support in the 105 area. Longer term I think we may well see Yen make the wedge target in the 80 area: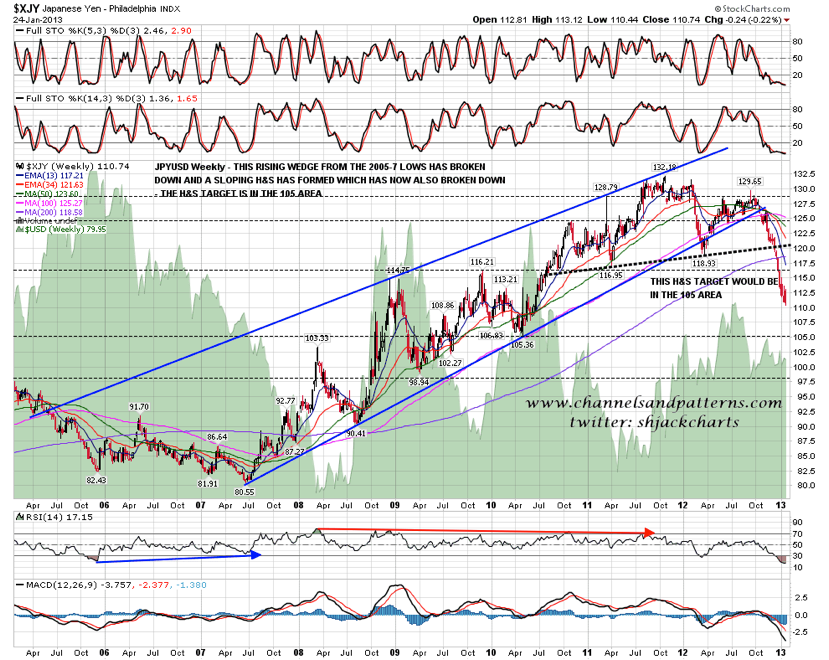
The last chart is the very nice looking long setup on KOL, still at a very attractive buy level. If you're looking for something to buy that's beaten down and offering a very nice looking bullish reversal setup, this is a decent looking play: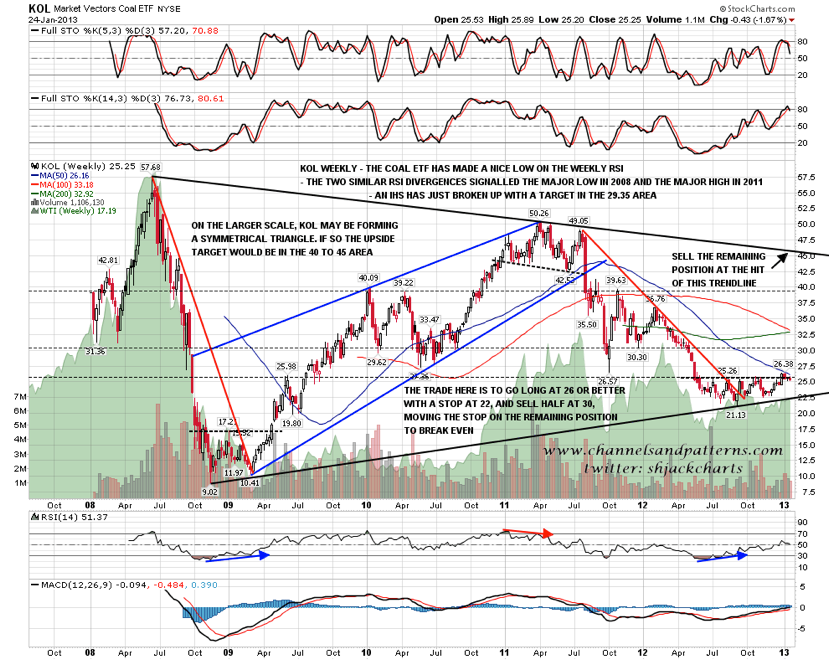
For today I'm looking for a higher high on ES over 1498 in the pre-market, followed by weakness into obvious support near the 50 hour moving average in the 1488.5 area, followed by strength. A break below 1486 would be a break of the current sequence of higher highs and lows and would suggest a test of support in the 1475 ES area.
- English (UK)
- English (India)
- English (Canada)
- English (Australia)
- English (South Africa)
- English (Philippines)
- English (Nigeria)
- Deutsch
- Español (España)
- Español (México)
- Français
- Italiano
- Nederlands
- Português (Portugal)
- Polski
- Português (Brasil)
- Русский
- Türkçe
- العربية
- Ελληνικά
- Svenska
- Suomi
- עברית
- 日本語
- 한국어
- 简体中文
- 繁體中文
- Bahasa Indonesia
- Bahasa Melayu
- ไทย
- Tiếng Việt
- हिंदी
Apple Near Primary Support
Published 01/25/2013, 10:52 AM
Updated 07/09/2023, 06:31 AM
Apple Near Primary Support
Latest comments
Loading next article…
Install Our App
Risk Disclosure: Trading in financial instruments and/or cryptocurrencies involves high risks including the risk of losing some, or all, of your investment amount, and may not be suitable for all investors. Prices of cryptocurrencies are extremely volatile and may be affected by external factors such as financial, regulatory or political events. Trading on margin increases the financial risks.
Before deciding to trade in financial instrument or cryptocurrencies you should be fully informed of the risks and costs associated with trading the financial markets, carefully consider your investment objectives, level of experience, and risk appetite, and seek professional advice where needed.
Fusion Media would like to remind you that the data contained in this website is not necessarily real-time nor accurate. The data and prices on the website are not necessarily provided by any market or exchange, but may be provided by market makers, and so prices may not be accurate and may differ from the actual price at any given market, meaning prices are indicative and not appropriate for trading purposes. Fusion Media and any provider of the data contained in this website will not accept liability for any loss or damage as a result of your trading, or your reliance on the information contained within this website.
It is prohibited to use, store, reproduce, display, modify, transmit or distribute the data contained in this website without the explicit prior written permission of Fusion Media and/or the data provider. All intellectual property rights are reserved by the providers and/or the exchange providing the data contained in this website.
Fusion Media may be compensated by the advertisers that appear on the website, based on your interaction with the advertisements or advertisers.
© 2007-2024 - Fusion Media Limited. All Rights Reserved.