AOL Inc. (AOL) is a global Web services company with a range of brands and offerings and a global audience. The Company's business spans online content, products and services, which it offers to consumers, publishers and advertisers. Its business operations are focused on AOL Properties and Third Party Network.
I found this stock using a real-time custom scan. This one hunts for elevated vols. AOL does have an earnings release in a day, so the elevated vol isn’t a surprise. But, it’s the level of the vol and the reaction of the stock to the prior earnings releases that caught my attention. Add to the mix a multi-year high in stock price and we have a compelling story.
Custom Scan Details
Stock Price GTE $5
IV30™ GTE 30
IV30™ Percentile GTE 80
Average Option Volume GTE 1,200
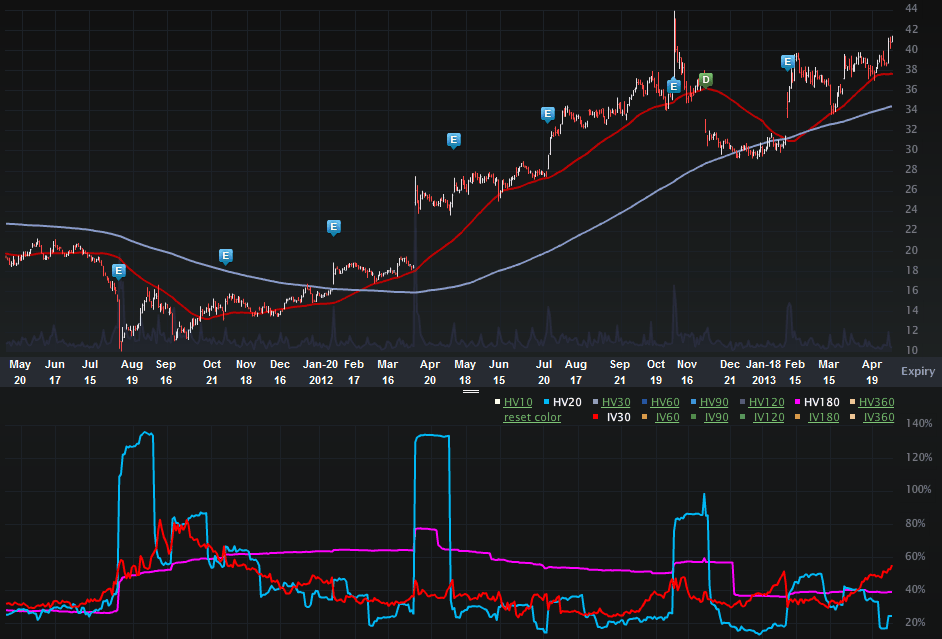
The two-year AOL Charts Tab is included (below). The top portion is the stock price the bottom is the vol (IV30™ - red vs HV20™ - blue vs HV180™ - pink).
On the stock side we can see a very nice price appreciation. This was a $19.35 stock two-years ago and it’s now trading more than 100% higher. In fact, the stock hit a low of ~$10 after an earnings release in early Aug of 2011, and from that point the stock has quadrupled. As of right now, the stock is near a multi-year high.
In fact, it’s the abrupt moves this stock makes off of earnings that caught my eye. Check out the blue “E” icons which denote earnings and how often the stock gaps when the new is released.
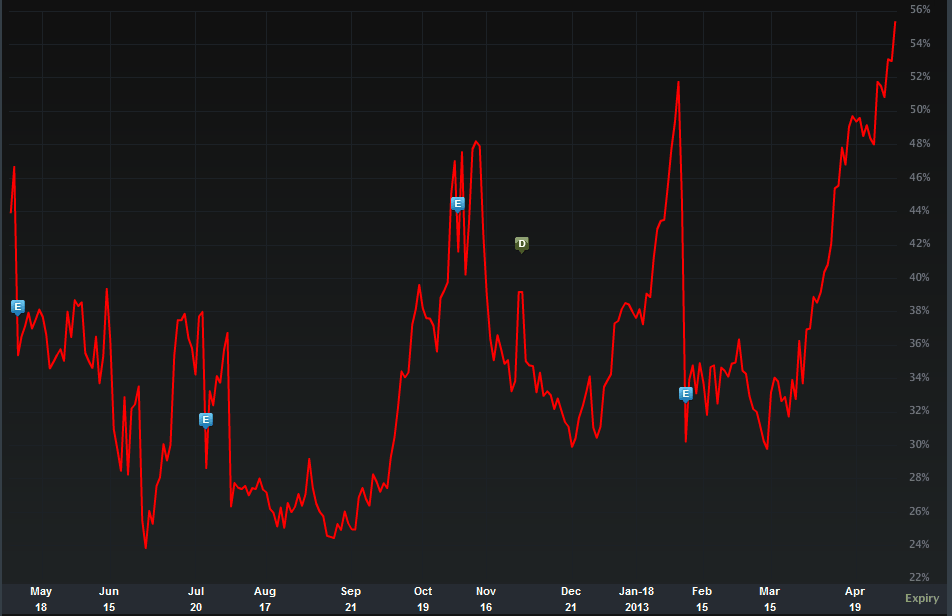
Let’s turn to the one-year IV30™ chart below to isolate the vol movement.
Again, the blue “E” icons represent earnings. Now take a look at the trajectory of the IV30™ of late into the earnings announcement in a day (two days but earnings are reported BMO). The vol is well into annual high territory and continues its rise today. The abrupt reactions to past earnings could be a part of this slightly frenzied vol in AOL along with the multi-year high in stock price. The option market reflects more risk in the next 30 days than it has for the last year ad that risk is tied directly to earnings. My best guess is that vol will continue to rise tomorrow and we will see yet higher annual highs, perhaps in the 57%-60% range in IV30™.
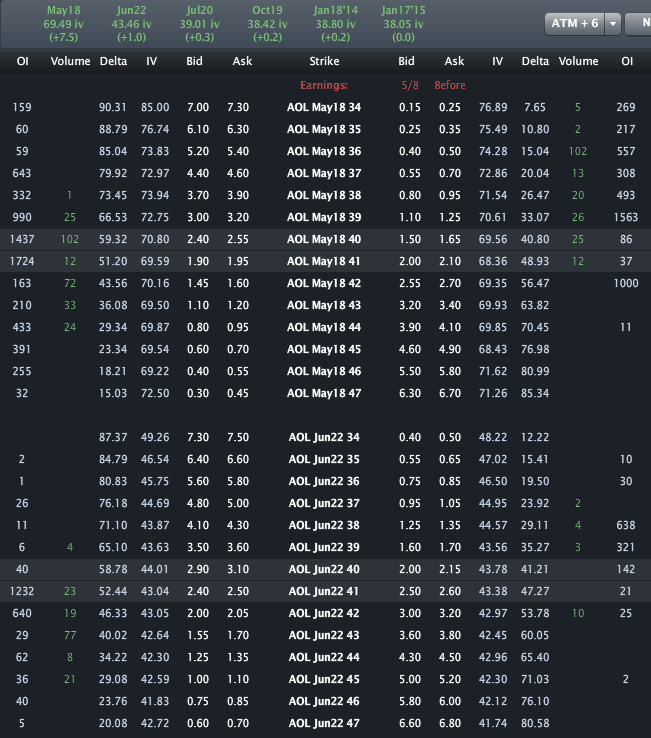
Finally, let's look to the Options Tab (below).
Across the top we can see the monthly vols are priced to 69.49% for May and 43.46% for Jun. Obviously that vol diff is earnings related. Though not pictured here, I note that the May 50 calls are dime bid and the May 32 puts are nickel bid. It feels like the option market is bracing for stock moving news come earnings. We’ll see…
Disclosure: This is trade analysis, not a recommendation.
Images provided by Livevol®
- English (UK)
- English (India)
- English (Canada)
- English (Australia)
- English (South Africa)
- English (Philippines)
- English (Nigeria)
- Deutsch
- Español (España)
- Español (México)
- Français
- Italiano
- Nederlands
- Português (Portugal)
- Polski
- Português (Brasil)
- Русский
- Türkçe
- العربية
- Ελληνικά
- Svenska
- Suomi
- עברית
- 日本語
- 한국어
- 简体中文
- 繁體中文
- Bahasa Indonesia
- Bahasa Melayu
- ไทย
- Tiếng Việt
- हिंदी
AOL Stock Breaches Annual Vol High; Flirts With Annual Price High
Published 05/07/2013, 03:07 AM
Updated 07/09/2023, 06:31 AM
AOL Stock Breaches Annual Vol High; Flirts With Annual Price High
Latest comments
Loading next article…
Install Our App
Risk Disclosure: Trading in financial instruments and/or cryptocurrencies involves high risks including the risk of losing some, or all, of your investment amount, and may not be suitable for all investors. Prices of cryptocurrencies are extremely volatile and may be affected by external factors such as financial, regulatory or political events. Trading on margin increases the financial risks.
Before deciding to trade in financial instrument or cryptocurrencies you should be fully informed of the risks and costs associated with trading the financial markets, carefully consider your investment objectives, level of experience, and risk appetite, and seek professional advice where needed.
Fusion Media would like to remind you that the data contained in this website is not necessarily real-time nor accurate. The data and prices on the website are not necessarily provided by any market or exchange, but may be provided by market makers, and so prices may not be accurate and may differ from the actual price at any given market, meaning prices are indicative and not appropriate for trading purposes. Fusion Media and any provider of the data contained in this website will not accept liability for any loss or damage as a result of your trading, or your reliance on the information contained within this website.
It is prohibited to use, store, reproduce, display, modify, transmit or distribute the data contained in this website without the explicit prior written permission of Fusion Media and/or the data provider. All intellectual property rights are reserved by the providers and/or the exchange providing the data contained in this website.
Fusion Media may be compensated by the advertisers that appear on the website, based on your interaction with the advertisements or advertisers.
© 2007-2024 - Fusion Media Limited. All Rights Reserved.
