Nearer-Term $ Index Outlook
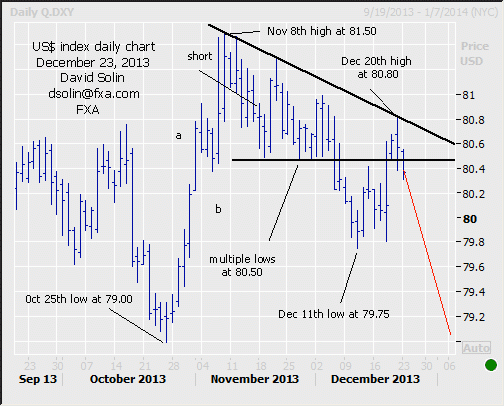
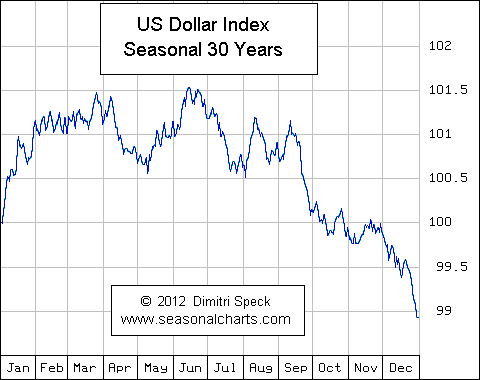
No change in the long held view of downside pressure into the end of the year, "ideally" back to the Oct low at 79.00, and even below (though further downside likely limited and part of a more important bottoming, see longer term below). Bigger picture negatives remain and include the 3 wave upmove from the Oct low at 79.00 (a-b-c, argues a correction/downside not "complete"), the seasonal chart that tumbles into the end of the year (see 3rd chart below) and the tendency for the market to grind in the direction of the larger trend during Dec (discussed in more detail in the Dec 16th email). Also in the Dec 16th email, warned of the risk for near term volatility (due to the Fed) but that an initial, sharp move would likely be limited. The market did indeed jump to a high at 80.80 last week, before rolling over, and with further weakness (for another week or 2) favored ahead. Nearby support is seen at 79.70/80 (Dec 11th low), then the longer term 78.50/00 area, resistance remains at the bearish trendline from early Nov (currently at 80.80/90).
Strategy/Position:
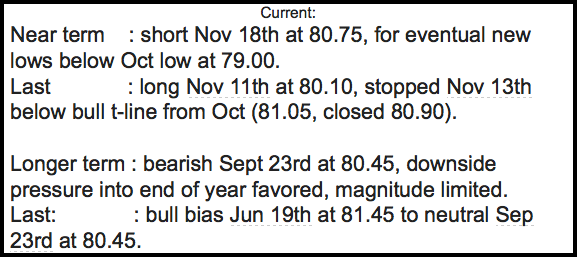
With at least another week or 2 of downside favored, would stay with the short position that was put in place on Nov 18th at 80.75. Continue to stop on a close 15 ticks above that bearish trendline from early Dec (which again held in the post Fed pop higher). However, will want to get more aggressive on nearby weakness, and especially an approach of the 78.50/00 support area and/or the start of the new year.
Long-Term outlook:
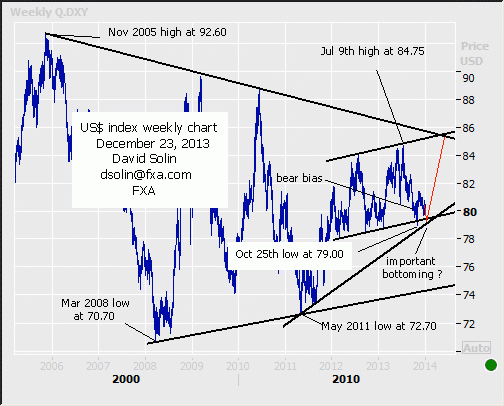
As discussed above, still favor near term downside back toward the Oct low at 79.00 and even below into the end of the year. But such weakness is likely to be part of a longer term bottoming and not the start of a major, new downleg. Note that lots of important support remains in the long discussed 78.50/00 area (Oct low, also bull trendline and 50% retracement from the May 2011 low at 72.70, base of the bull channel from Feb 2012). Additionally, the market remains within the much larger triangle/ pennant (trading in a tighter and tighter range) that has been forming since the Nov 2005 high at 84.75. With the My 2011 low at 72.70 seen testing the base, eventual gains toward the ceiling (currently at 85.75/00) are favored. This in turn adds to the view of a more important bottoming in the 78.50/00 area over the next week or 2 (see "ideal" scenario in red on weekly chart/2nd chart below).
Strategy/Position:
With downside into the end of the year still favored, would stay with the longer term bearish bias that was put in place on Sept 23rd at 80.45 for now. But as with the shorter term above, will be looking for signs of a more important bottoming as the 78.50/00 area and/or start of new year approaches.

Foreign Exchange Analytics


US Dollar Index

