The bull case for the US dollar that we have presented is based on an underlying divergence. It is true that in any one quarter, the eurozone and/or Japan can grow faster than the US. The divergence we have stressed is the trajectory of monetary policy. Simply put, the Federal Reserve has stopped easing policy. It is looking for an opportunity to hike the Fed funds target range.
Like many others, we have shifted our expectation from June to September. Of course, it is not a done deal, and it is predicated on the continued absorption of slack in the labor market. The Fed's leadership believes that over time, this will exert upward pressure on wages. This in turn will see core inflation rise.
Meanwhile, the ECB has just begun its bond buying program. ECB President Draghi is likely to explain at this week's press conference that the slight increase in eurozone inflation was expected and does not mean that the bond buying program will end early. The BOJ is also engaged in aggressive expansion of its balance sheet, and although capex was stronger than assumed, meaning that Q1 GDP is likely to be revised higher, it too has not even begun discussing tapering or exit from QE.
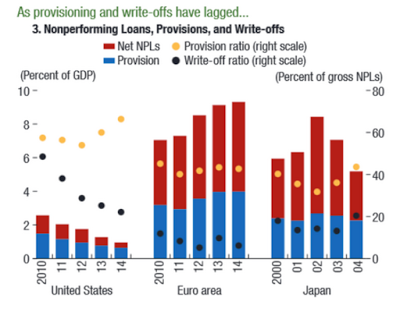
There is another divergence at work. The US took aggressive action to recapitalize large US banks.European banks are lagging well behind. This Great Graphic was tweeted by Juhani Hoopainen.
It shows not only the net non-performing loans, as a percentage of GDP, but it also shows the provisioning (reserves) put aside to cover those bad loans. It also shows the provision ratio and the write-off ratio.
The conclusion to be drawn from this is that the debt overhang at US banks has been largely absorbed. If anything, it suggests that US banks may have over-provided for their non-performing loans. They can and have clawed some of these funds back.
Note that the chart shows US and European banks for the 2010-2014 period. The European debt overhand problem appears to have grown. Write-off remain low and provisioning flattened out. The provision ratio is also considerable lower than at US banks. The data for Japanese banks is for the 2000-2004. European banks appear to be in worse shape than Japanese banks then.
Specifically, US banks have written off or provided for 90% of their non-performing loans. For eurozone banks as whole, the ratio is near 50%. Non-performing loans amount to 1% of US GDP. In the eurozone, they are 9% of GDP.
When considering why the couple hundred billion euros in assistance has not put Greece on a competitive growth path, there are two levels of explanation. One is Greece domestic politics, which seems well understood now. The analysis cannot stop there. The other level of analysis is this debt overhang at European banks. The aid programs were not designed to boost Greece's competitiveness, but rather to support the fragile European banks. This fragility is illustrated by large non-performing loans; the unwillingness to write them off or to make adequate provisions. European banks, no less than Greece have not managed to address their underlying problems.

