I find it interesting how the market players ignore and marginalize analysis that is not market friendly. You can stop reading now if you only want to read positive (market friendly) analysis.
Consider that an analyst working for a market participant would likely never be fired for exaggerating a positive outlook - but how about a situation where the analyst's pessimistic outlook was wrong. Wall Street rewards positive outlooks, and penalizes negative outlooks.
Wall Street makes more money in a rising market, and much less in a falling market. There is an advantage to talk up the markets. The markets (for many reasons) do not have to follow the trends of the economy for lengthy periods of time. For longer periods of time, the general trends should match. The graph below compares the S&P 500 index (red line) and the super economic coincident indicator Chicago Fed National Activity Index (CFNAI shown as a blue line) - and it shows that the economy has slowed - but the market continues to rise (red line).

The CFNAI is not configured like GDP - as it uses both monetary and non-monetary inputs. Some believe there is a methodology issue with 1Q GDP (a monetary metric) - but I work with many non-monetary indicators - and although there may be a methodology issue with GDP, 1Q2015 non-monetary data was terrible.
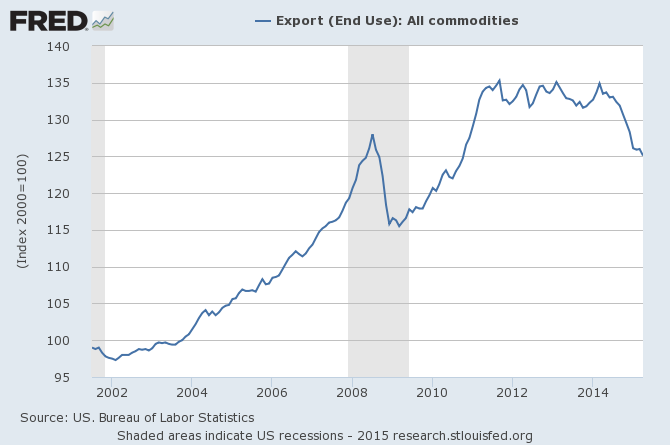
Currently, the market is either ignoring the economy, or believing the economic situation is transitory, as it has been many times previously. The outlook for the global economy is not good, and I find it hard to believe that the USA can be an island of prosperity. A poor global economy reduces exports (and more importantly also pressures profits as competition is stronger) - and in 1Q2015 export decline removed 0.4% from GDP over the previous quarter. This is NOT a transitory issue as exports now have been declining for over one year.
This past week we released our June 2015 economic outlook which continues to weaken. Most tracked sectors of the economy are relatively soft with most expanding well below rates seen since the end of the Great Recession. When data is this weak, it is not inconceivable that a different methodology could say the data is recessionary. The significant softening of our forecast this month was triggered by marginal declines in many data sets which are dancing closer and closer to zero growth.
Econintersect Economic Index (EEI) with a 3 Month Moving Average (red line)
 with a 3 Month Moving Average")
Our employment six month forecast continues to forecast relatively strong employment growth, but beginning this month our forecast is for marginally slower rates of growth. Consider that we are adding jobs to the economy, but they are not jobs of equal compensation compared to pre-Great Recession.
The state of the economy is not market friendly - and I have seen no long range forecast which claims a strong growth cycle is coming.
Other Economic News this Week:
The Econintersect Economic Index for June 2015 continues to weaken. Most tracked sectors of the economy are relatively soft with most expanding well below rates seen since the end of the Great Recession. When data is this weak, it is not inconceivable that a different methodology could say the data is recessionary. The significant softening of our forecast this month was triggered by marginal declines in many data sets which are dancing closer and closer to zero growth. Please note that most 6 month outlook forecasts are for a marginally improving economy.
The ECRI WLI growth index is now in positive territory but still indicates the economy will have little growth 6 months from today.
Current ECRI WLI Growth Index

The market was expecting the weekly initial unemployment claims at 265,000 to 275,000 (consensus 270,000) vs the 282,000 reported. The more important (because of the volatility in the weekly reported claims and seasonality errors in adjusting the data) 4 week moving average moved from 266,500 (reported last week as 266,250) to 271,500. The rolling averages have been equal to or under 300,000 for most of the last 7 months.
Weekly Initial Unemployment Claims - 4 Week Average - Seasonally Adjusted - 2011 (red line), 2012 (green line), 2013 (blue line), 2014 (orange line), 2015 (violet line)

Bankruptcies this Week: IMRIS
Weekly Economic Release Scorecard:
