In technical and charting analysis, one of the simplest techniques to utilize is trend-line analysis. It basically involves drawing a line on a chart connecting either a rising series of lows (up trend line) or a declining series of highs (down trend line). Of course, there are nuances involved. Though, to be honest, the more nuances involved, the less successful the trend-line analysis is likely to be. The beauty of trend-lines really are in their simplicity.
That is probably what allows them to continue to work so well. Most market observers scoff at the technique, considering it too basic to be taken seriously. Yet, time after time we see this barbarous chart technique work – and make observant analysts money in the process. You can see examples weekly in our #TrendlineWednesday feature on Twitter and StockTwits.
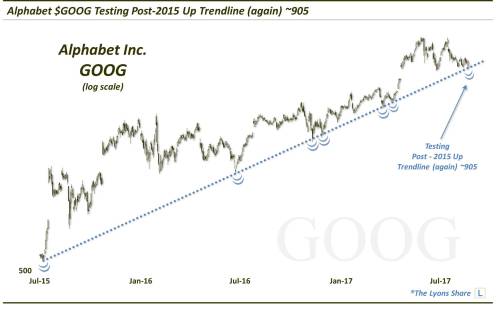
Today’s headline trend line – and the Chart Of The Day – highlights a trend line that has consistently supported one of this bull market’s leaders over the past few years: Alphabet (NASDAQ:GOOG). We featured it today as the trend line was tested again on Wednesday – successfully, so far.

The trend line in question originates at the July 2015 low and connects roughly half a dozen lows since then, including the Brexit low, the lows near last year’s U.S. presidential election and a couple touches this past spring. Presently, the trend line is intersecting near the 905 level. Wednesday’s low price (into the North Korea-induced jitters) was 905.00 on the dot. It bounced immediately off that level, arguing for the trend line’s continued relevance.
Where will it go next? First off, as long as the trend line holds, expect GOOG to remain on the rise and a leader in this rally. Furthermore, as long as the rally leaders are still moving higher, a significant decline remains doubtful.
Beyond that, in a post at The Lyons Share, we spelled out our specific strategy for taking advantage of the GOOG opportunity, including the key levels to watch on the upside and the downside.
The PowerShares QQQ ETF (NASDAQ:QQQ) was trading at $145.53 per share on Thursday morning, up $0.88 (+0.61%). Year-to-date, QQQ has gained 23.42%, versus a 11.54% rise in the benchmark S&P 500 index during the same period.
QQQ currently has an ETF Daily News SMART Grade of A (Strong Buy), and is ranked #1 of 35 ETFs in the Large Cap Growth ETFs category.
From Dana Lyons: Long-time rally leader Alphabet looks to undergo another successful test of its long-term Up trendline.
Disclaimer: JLFMI’s actual investment decisions are based on our proprietary models. The conclusions based on the study in this letter may or may not be consistent with JLFMI’s actual investment posture at any given time. Additionally, the commentary provided here is for informational purposes only and should not be taken as a recommendation to invest in any specific securities or according to any specific methodologies. Proper due diligence should be performed before investing in any investment vehicle. There is a risk of loss involved in all investments.
