
Alphabet Inc.’s (NASDAQ:GOOGL) non-GAAP earnings of $9.93 in the first quarter of 2018 exceeded the Zacks Consensus Estimate of $9.21. Also, earnings increased 3% sequentially and 29% year over year.
The Internet powerhouse reported decent top-line numbers. Net revenues, excluding total traffic acquisition cost or TAC (TAC is the portion of revenues shared with Google’s partners, and amounts paid to distribution partners and others who direct traffic to the Google website), came in at $24.9 billion, slightly above the Zacks Consensus Estimate of $24.2 billion.
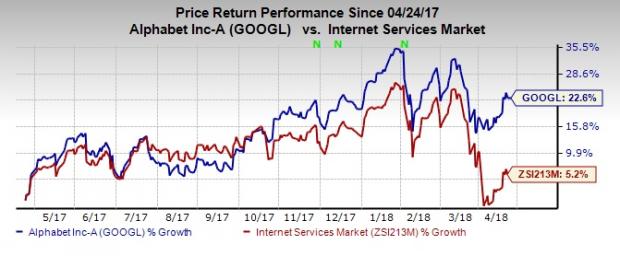
Coming to price performance, Alphabet’s shares have returned 22.5% in the past 12 months, outperforming the industry’s growth of 5.2%.
The company stated that Google Cloud is generating substantial revenues, reflecting ongoing momentum in the business. Its cloud business now generates more than $1 billion in sales per quarter.
The primary drivers of the Google business haven’t changed. Pricing remains under pressure both on account of nagging FX concerns, as well as continued strength in mobile and TrueView.
Google continues to enjoy strength in the mobile platform. One of the drivers is Accelerated Mobile Pages (AMP), which is being accepted by a number of publishers and sites across the world. Management is focused on driving mobile experiences and the company is well positioned to pick up strong intent-to-buy signals by studying mobile searches from its huge database. As a result, direct response marketers continue to show interest in it.
YouTube continues to remain a strong contributor, benefiting from growth in online video consumption. More than a thousand creators are currently engaged in the platform, bringing in a thousand subscribers every day.
Finally, Google platforms like Android, Chrome and Daydream continue to help it in drawing more users and selling more ads.
Numbers in Detail
Revenues
Gross total revenues of $31.1 billion were down 3.6% sequentially but up 25.8% year over year (up 23% in constant currency or CC). The year-over-year increase was primarily driven by strength in mobile search. Also, healthy growth in network revenues, hardware, cloud and Play aided revenue growth.
Google Segment
The segment includes search, advertising, Play, hardware, and Cloud & Apps.
Coming to the search business, revenues from Google-owned sites fell 1.1% on a sequential basis, while that from partner sites declined 6.9%, resulting in a decrease of 2.1% in total advertising revenues. However, Google-owned sites and partner sites grew 26.4% and 15.9%year over year, respectively, accounting for 70.6% and 14.9% of quarterly revenues.
Management said that mobile search continued to benefit from improvements in ad formats and delivery initiated in the third quarter of 2015, as well as remained optimistic about search revenue growth on both tablets and desktops.
Other revenues decreased 7.1% sequentially but increased 35.8% year over year, accounting for 14% of first-quarter revenues.
Other Bets Segment
In the first quarter, Other Bets revenues were $150 million, primarily generated by Fiber and Verily. Revenues were down 63.3% but up 13.6% year over year and accounted for 0.5% of total revenues.
Total traffic acquisition cost or TAC was down 2.5% sequentially but up 35.8% year over year.
TAC paid out to network partners decreased 7.8% sequentially whereas increased 19.9% year over year. Given that mobile search carries higher TAC, the increase in mobile search revenues is driving related TAC, according to management.
TAC for distribution arrangements was up 4.5% sequentially and 60.8% year over year.
Net advertising revenues, excluding TAC, were down 3.9% sequentially but up23.5% from the prior-year quarter.
Margins
Gross margin of 56.8% decreased 875 basis points (bps) sequentially and 366 bps from the year-ago quarter.
Price declines remained negative in both sequential and year-over-year comparisons, as the mix continued to move toward lower-margin business.
Cost per click (CPC) on Google sites was down 7% sequentially and 19% from the year-ago quarter. However, Cost-per-impression on Google Network Members' properties decreased 10% sequentially but increased 18% year over year.
Paid clicks on Google properties grew 8% sequentially and 59% from the year-ago quarter, driven partly by growing volumes of mobile and TrueView ads on YouTube. Google Impressions on Google Network Members' properties grew 5% sequentially and remained flat from the year-ago quarter.
Operating expenses of $10.7 billion increased 27.3% year over year. Operating margin was 22.5%, down 400 bps from the year-ago quarter.
Balance Sheet
Alphabet has a solid balance sheet, with cash and short-term investments of around $102.9 billion, up from $101.9 billion in the fourth quarter. The company generated around $11.6 billion of cash from operations in the first quarter and spent $7.3 billion on capex, netting a free cash flow of $4.3 billion.
Alphabet Inc. Price, Consensus and EPS Surprise
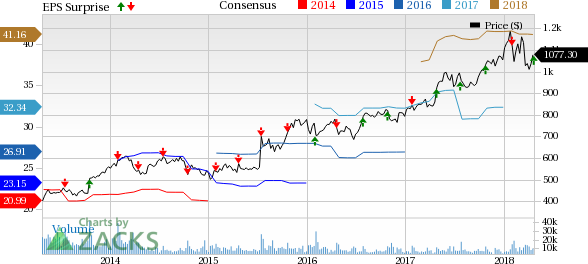
Alphabet Inc. Price, Consensus and EPS Surprise | Alphabet Inc. Quote
Zacks Rank and Stocks to Consider
Alphabet carries a Zacks Rank #4 (Sell).
Some better-ranked stocks in the technology sector are Baidu, Inc. (NASDAQ:BIDU) , Etsy, Inc. (NASDAQ:ETSY) and Match Group, Inc. (NASDAQ:MTCH) , each sporting a Zacks Rank #2 (Buy). You can see the complete list of today’s Zacks #1 (Strong Buy) Rank stocks here.
Long-term earnings per share growth rate for PetMed, Teradyne and Mercadolibre is projected to be 20.8%, 17.3% and 12.5%, respectively.
"Will You Make a Fortune on the Shift to Electric Cars?
Here's another stock idea to consider. Much like petroleum 150 years ago, lithium power may soon shake the world, creating millionaires and reshaping geo-politics. Soon electric vehicles (EVs) may be cheaper than gas guzzlers. Some are already reaching 265 miles on a single charge.
With battery prices plummeting and charging stations set to multiply, one company stands out as the #1 stock to buy according to Zacks research.
It's not the one you think.
Baidu, Inc. (BIDU): Free Stock Analysis Report
Etsy, Inc. (ETSY): Free Stock Analysis Report
Match Group, Inc. (MTCH): Free Stock Analysis Report
Alphabet Inc. (GOOGL): Free Stock Analysis Report
Original post