Get 40% Off
☕ Buy the dip? After losing 17%, Starbucks sees an estimated 20% upside. See the top Undervalued stocks!Unlock list

All New Market Analysis - 05.07.18

Published 07/05/2018, 09:25 AM
Updated 07/09/2023, 06:31 AM
  • SPX Monitoring purposes; Long SPX on 6/29/18 at 2718.37
  • Monitoring purposes Gold: Neutral
  • Long Term Trend SPX monitor purposes: Long SPX on 6/29/18 at 2718.37
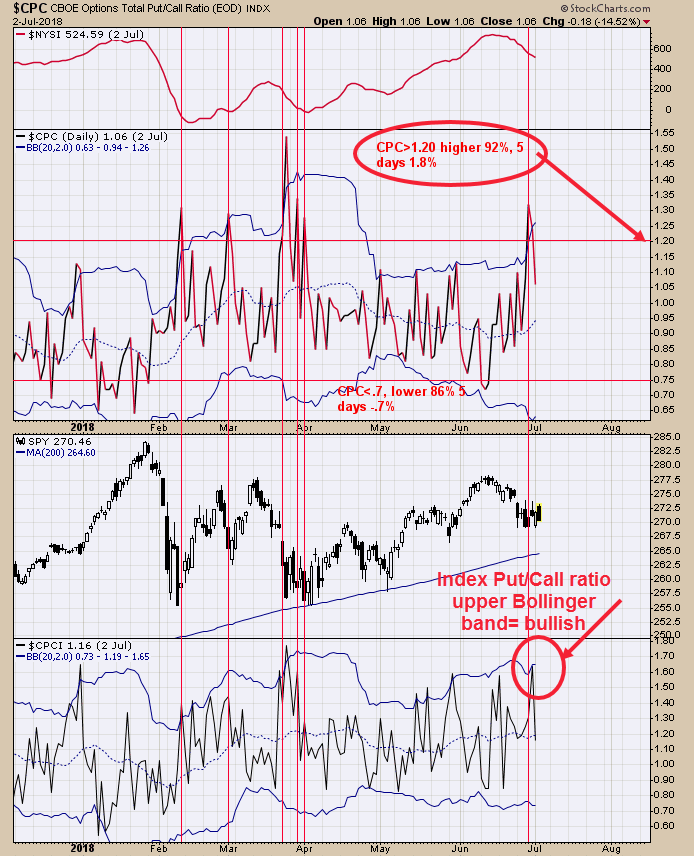
  • CPC Daily Chart

    We updated this chart from yesterday. The upper window is the Total put/call ratio (CPC). When CPC reaches great than 1.20 (Friday’s reading came in at 1.32) the market as higher 92% of the time within five days with an average gain of 1.8%. The bottom window is the Index put/call ratio. When this ratio reaches its upper Bollinger band, than market is near a low and this ratio reached its upper Bollinger band® yesterday. These studies goes long with our bullish TRIN and TICK readings the last couple of days and the cycle turn date that come around the July 4 holiday. Market may test its June highs if not higher. The worst performing months of the year are August and September so most likely another top may form in the coming weeks.
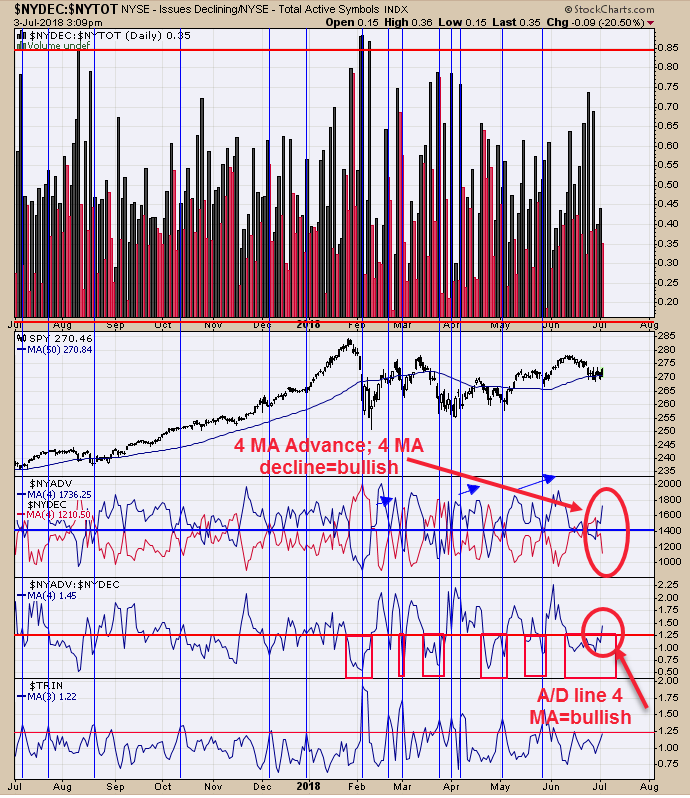
    NYDEC Daily Chart

    Two indictors triggered buy signals today. The second window up form the bottom is the NYSE Advance/NYSE Decline with a 4 period moving average. Readings above 1.25 have been a bullish sign for the SPX. Next window up is the NYSE advancing issues with 4 period moving average (blue line) and NYSE Declining issues with 4 period moving average (red line). When Blue line is on top (like now) than market is considered in an uptrend. Though the SPX was down today the internals where bullish. Long SPX on 6/29/18 at 2718.37.
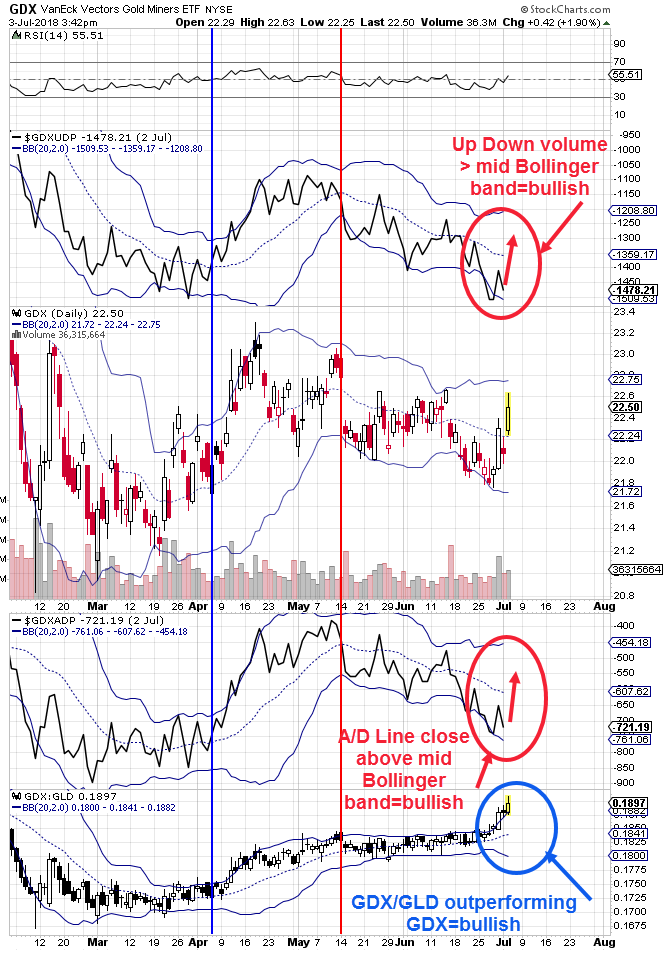
    GDX Daily Chart

    Today’s closing for Up Down Volume and Advance/Decline indicators won’t be updated until later tonight. To signal a bullish run is starting for GDX the Cumulative Advance/Decline and Cumulative Up Down Volume need to close above their mid Bollinger bands and that the Mid Bollinger band turn up. As you can see from the chart above both are below their mid Bollinger band. Once the Cumulative A/D and Up Down volume indicators trigger their buy signals, a longer term uptrend could start. The COT Gold Commercials are 95K short; previous commercials gold shorts less than 100K has come near gold bottoms. There are cycle lows due starting June 25 and run into July 4.

3rd party Ad. Not an offer or recommendation by Investing.com. See disclosure here or remove ads .

Latest comments

Risk Disclosure: Trading in financial instruments and/or cryptocurrencies involves high risks including the risk of losing some, or all, of your investment amount, and may not be suitable for all investors. Prices of cryptocurrencies are extremely volatile and may be affected by external factors such as financial, regulatory or political events. Trading on margin increases the financial risks.
Before deciding to trade in financial instrument or cryptocurrencies you should be fully informed of the risks and costs associated with trading the financial markets, carefully consider your investment objectives, level of experience, and risk appetite, and seek professional advice where needed.
Fusion Media would like to remind you that the data contained in this website is not necessarily real-time nor accurate. The data and prices on the website are not necessarily provided by any market or exchange, but may be provided by market makers, and so prices may not be accurate and may differ from the actual price at any given market, meaning prices are indicative and not appropriate for trading purposes. Fusion Media and any provider of the data contained in this website will not accept liability for any loss or damage as a result of your trading, or your reliance on the information contained within this website.
It is prohibited to use, store, reproduce, display, modify, transmit or distribute the data contained in this website without the explicit prior written permission of Fusion Media and/or the data provider. All intellectual property rights are reserved by the providers and/or the exchange providing the data contained in this website.
Fusion Media may be compensated by the advertisers that appear on the website, based on your interaction with the advertisements or advertisers.
© 2007-2024 - Fusion Media Limited. All Rights Reserved.