First the reality. Nobody knows what the market is going to do. Yes, I am aware that there are roughly a bazillion people out there “prognosticating” (myself included) about the stock market. And yes, if one makes enough “predictions”, the law of averages dictates that one will be correct a certain percentage of the time.
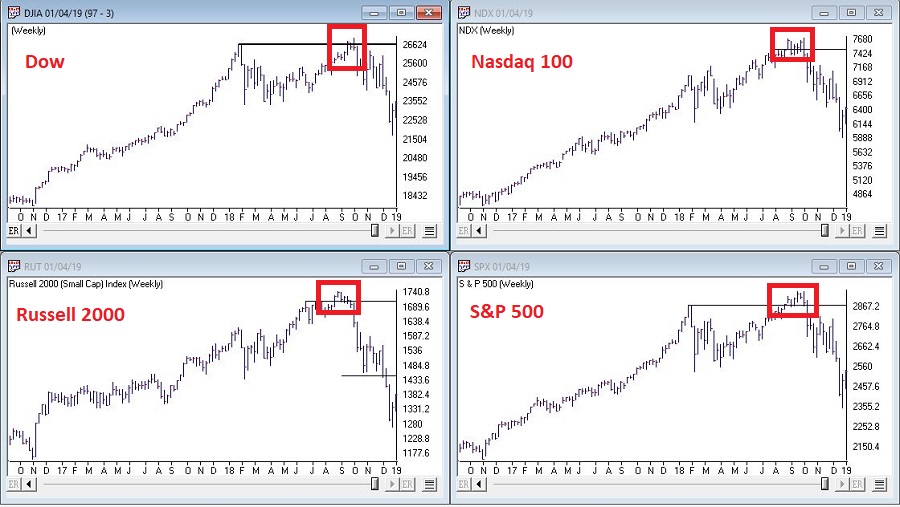
Still, the market does offer clues. Sometimes those clues turn out to be false leads. But sometimes they do offer important information. For example, Figure 1 displays four major market indexes. As you can see, in the Aug-Sep-Oct time frame all four of these averages “broke out” to new all-time highs (i.e., The Good News) and then broke back down below the previous resistance line drawn on each chart (i.e., The Bad News).

Figure 1: Courtesy AIQ TradingExpert
False breakouts happen all the time. And the reality here is that sometimes they mean something and sometimes they don’t. But when all four major average do the same thing, a warning sign has been issued to those who are interested in seeing it. That’s why it can be useful to seek “confirmation”. For my purposes I look to what I refer to as my 4 “bellwethers”, which are:
VanEck Vectors Semiconductor (NYSE:SMH) – Semiconductors
TRAN – Dow Transportation Average
ZIV – Velocity Shares Inverse VIX Index
Sotheby’s (NYSE:BID) – Sotheby Holdings
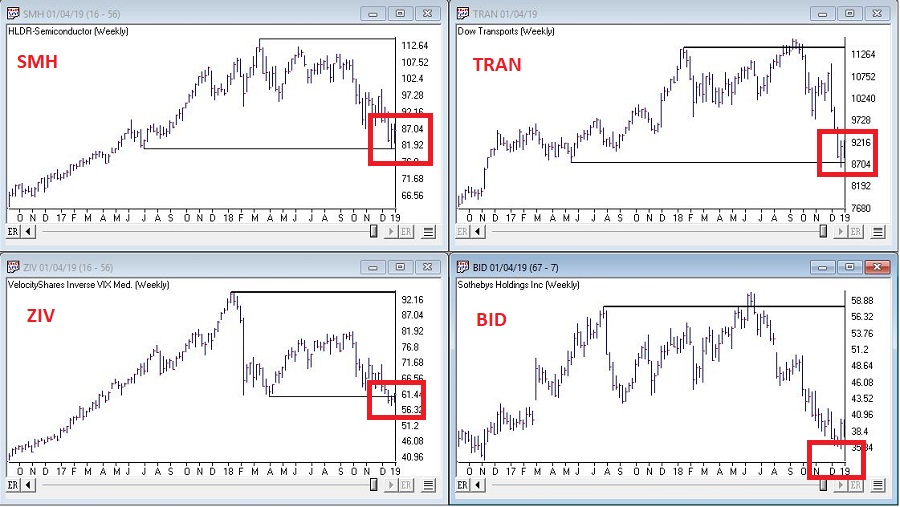
These tickers appear in Figure 2

Figure 2: Courtesy AIQ TradingExpert
While the major indexes were testing new highs in Aug/Sep and then breaking down in October:
SMH – Never really came close to breaking out above its March high
TRAN – Followed the major indexes by hitting new highs in Aug/SP and then breaking down in October
VelocityShares Daily Inverse VIX Medium Term (NASDAQ:ZIV) – Never came anywhere close to its Jan-2018 high
BID – Broke to a new high in Jun/Jul, then failed badly.
In a nutshell, the failed major index breakouts were accompanied by absolutely no positive signs from the 4 bellwethers. So, the warning signs were there if one wished to see them.
So where are the bellwethers now? Another close look at Figure 2 reveals that:
SMH – the key support level at 80.92
TRAN – the key level for the Dow Transports is 8744.36
ZIV – the key support level is 60.60
BID – a potential support level is 32.95 (the Apr 2013 low)
Summary
*Given the washed-out/oversold level that many indicators and sentiment surveys have reached…
*…Combined with the fact that we are in the seasonally favorable pre-election year (no down pre-election years since the 1930’s)
*There is a chance that 2019 could be surprisingly bullish, and shell-shocked investors should not stick their heads in the sand to the possibility.
At The Same Time
*Based solely on trend-following indicators ALL of the major market indexes are technically in confirmed bear markets. As a result, there is absolutely nothing wrong with having some portion of one’s capital in defensive positions at the moment (30% cash or short-term bonds?).
*Keep a close eye on January performance. A bullish January would be a positive sign just as a negative January could – in this case – signal a continued market decline.
*Keep a close eye on the 4 Bellwethers relative to their respective support levels.
In a nutshell:
*Up January + Bellwethers holding above support = GOOD
*Down January + Bellwether breaking down below support = BAD
Those are all the “clues” I can offer at the moment.
