
Agrium Inc. (NYSE:AGU) posted net earnings (attributable to its equity holders) of $564 million or $4.08 per share in the second quarter of 2016, a roughly 16.3% decline from $674 million or $4.71 per share recorded a year ago. The bottom line in the reported quarter was hurt by weaker selling prices across all nutrients.
Agrium’s adjusted earnings came in at $4.09 per share for the reported quarter. Analysts polled by Zacks were expecting earnings per share of $4.05 on an average.
Revenues decreased 8.3% year over year to $6,415 million in the reported quarter. The top line also missed the Zacks Consensus Estimate of $6,645 million.
Shares of the company fell 0.9% to close at $89.40 on Aug 4.
Segment Review
Revenues from the Retail segment decreased 6% year over year to $5.79 billion. However, gross profit rose 1.2% year over year to $1.28 billion. While sales were negatively impacted by low crop nutrient selling prices, increase in higher-margin product sales triggered growth in profits.
Within the Retail business, crop nutrient sales declined 16% year over year to $2,190 million, owing to weaker global pricing across all nutrients. The segment saw slightly lower quarterly sales volumes of crop nutrients compared with the prior-year quarter due to early spring in the U.S. leading to higher volumes in the first quarter. Crop protection sales went up 3.7% to $2,250 million as the weather supported crop protections applications. Seed sales decreased 5.7% year over year to $926 million in the reported quarter, while Merchandise sales fell 6.9% to $162 million.
Sales from the Wholesale segment plunged 24.9% year over year to $882 million, as realized sales prices were pressured by weaker nutrient prices globally. Gross profit was $201 million in the reported quarter, declining significantly from $409 million in the year-ago quarter.
Within the Wholesale business, nitrogen gross profits fell roughly 45.2% year over year to $148 million, attributable to significantly lower global benchmark nitrogen prices, partly offset by reduced cost of production. Potash and phosphate gross profits plummeted 76.5% and 82.8% year over year to $16 million and $5 million, respectively. The plunge was primarily due to downward pressure on prices.
Sales volumes decreased roughly 4.5% year over year to 1,168,000 tons due to an extended planned outage at the Borger facility as well as strong ammonia sales volume in the first quarter. Potash sales volumes were 697,000 tons in the reported quarter compared with 509,000 tons in the prior-year quarter. Phosphate sales volumes rose 5.2% to 305,000 tons.
Financial Position
Agrium ended the second quarter with cash and cash equivalents of $307 million, down roughly 52.6% year over year. Long-term debt dropped around 2.7% year over year to $4,412 million as of Jun 30, 2016. Cash provided by operations declined around 45% year over year to $438 million in the quarter.
The company declared a quarterly dividend of 87.5 cents, payable on Oct 20, 2016 to shareholders on record as of Sep 30.
Outlook
Agrium provided its annual earnings guidance for 2016 in the range of $5.00−$5.30 per share, down from its prior view of $5.25–$6.25. The company trimmed its outlook due to a challenging pricing environment for all nutrients.
Agrium reiterated its full-year nitrogen and potash sales volume guidance of 3.5−3.7 million tons and 2.3−2.4 million tons, respectively.
Retail crop nutrient sales tons for 2016 are now projected to be in the range of 9.8–10.2 million tons (compared with 9.8–10.3 million tons expected earlier).
AGRIUM INC Price, Consensus and EPS Surprise
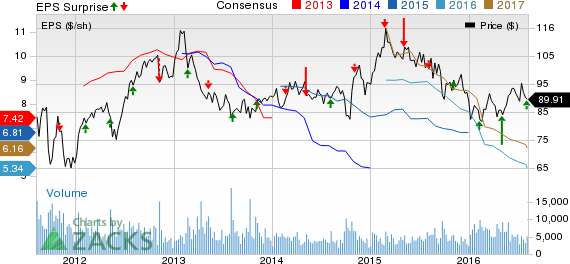
AGRIUM INC Price, Consensus and EPS Surprise | AGRIUM INC Quote
Zacks Rank
Agrium currently has a Zacks Rank #5 (Strong Sell).
Some better-ranked companies in the basic materials space include Chemical & Mining Co. of Chile Inc. (NYSE:SQM) , E. I. du Pont de Nemours and Company (NYSE:DD) and FMC Corp. (NYSE:FMC) , all holding a Zacks Rank #2 (Buy).
DU PONT (EI) DE (DD): Free Stock Analysis Report
FMC CORP (FMC): Free Stock Analysis Report
AGRIUM INC (AGU): Free Stock Analysis Report
SOC QUIMICA MIN (SQM): Free Stock Analysis Report
Original post
Zacks Investment Research