
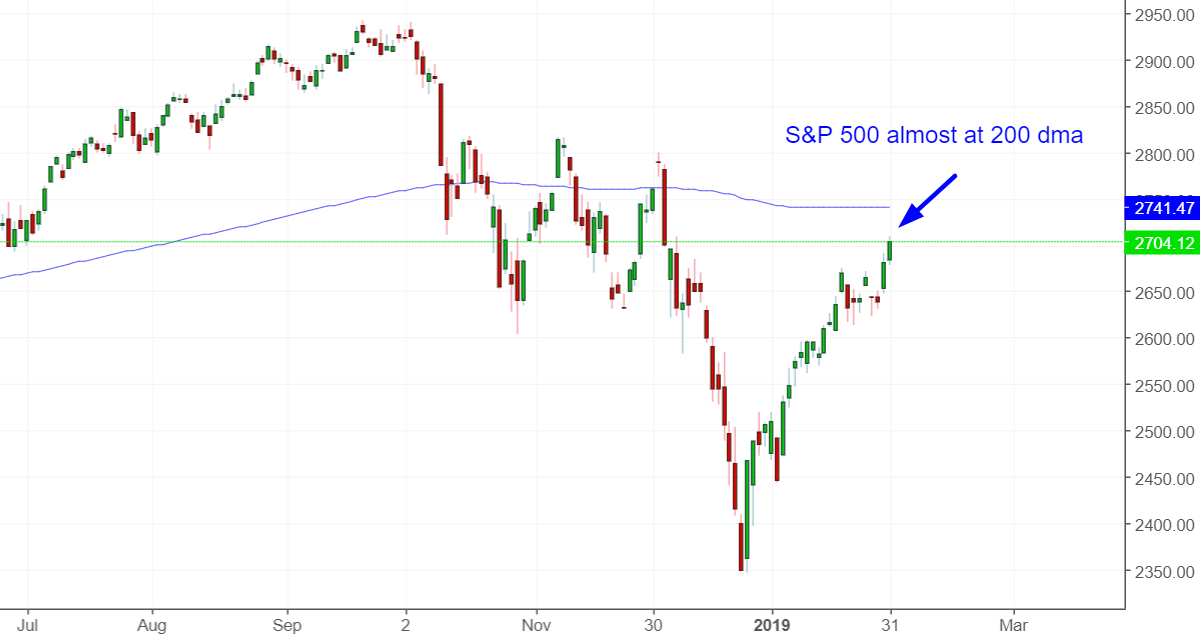
This has been a terrific January for stocks. Risk-on assets like stocks and oil have risen, while safe haven assets like the US Dollar have fallen. With the S&P 500 approaching its 61.8% retracement and 200 day moving average, our base case remains the same: medium term is neutral and a short term pullback is likely.
Go here to understand our fundamentals-driven long term outlook.
Let’s determine the stock market’s most probable medium term direction by objectively quantifying technical analysis. For reference, here’s the random probability of the U.S. stock market going up on any given day.

*Probability ≠ certainty. Past performance ≠ future performance. But if you don’t use the past as a guide, you are blindly “guessing” the future.
Terrific January
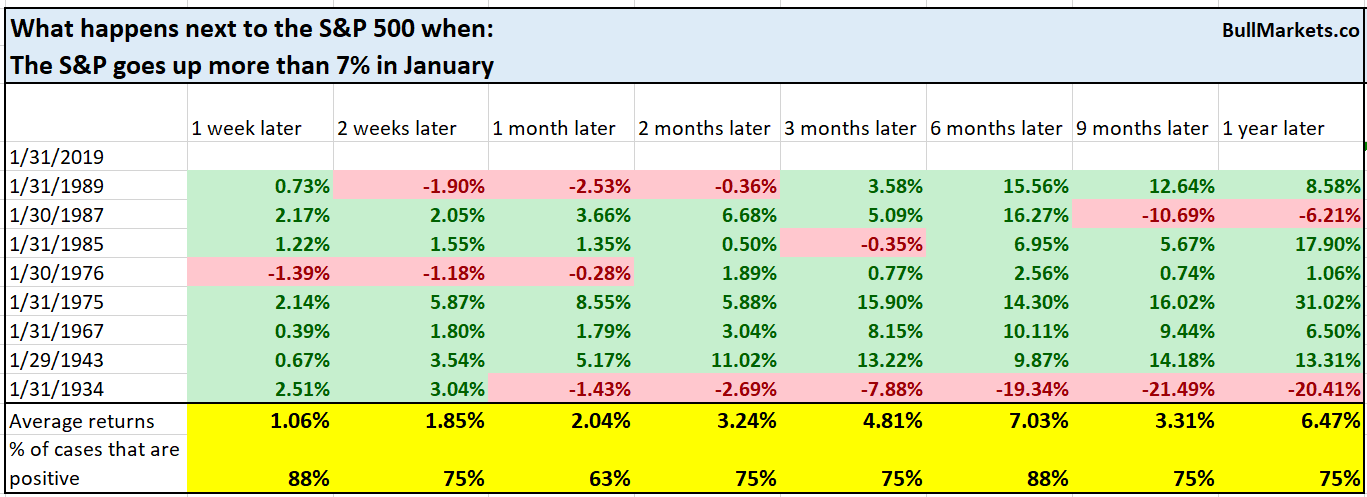
It’s been a terrific January for stocks. The S&P 500 has gone up more than 7%. There’s a common saying for stock market seasonality:
As January goes, so goes the rest of the year
Here’s what happens next to the S&P 500 when it goes up more than 7% in January.
*Data from 1923-present
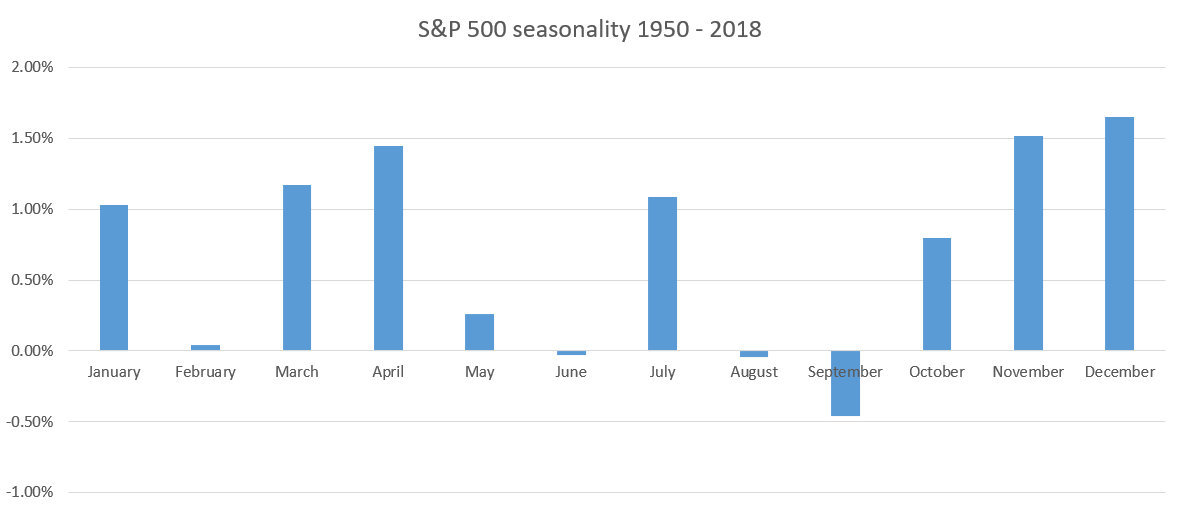
From a seasonality perspective, February isn’t as bullish as January for stocks
Everything is up
It’s not just stocks that are up. All risk-on financial assets are going up, while safe haven assets like the U.S. Dollar are falling.
CNBC noted this too:
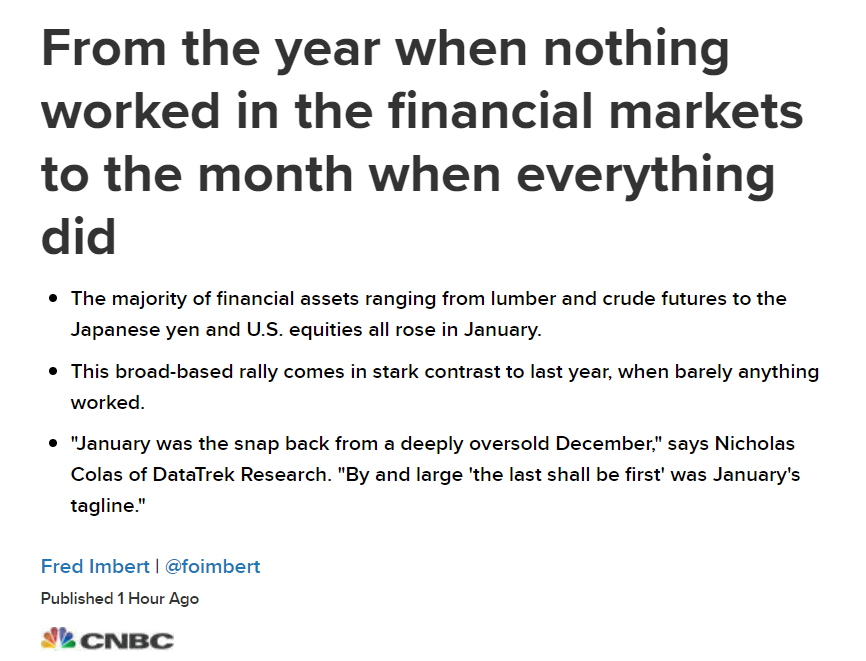
It’s exceedingly rare for stocks and oil to soar at the same time.
There have only been 2 other cases in which the S&P 500 went up more than 7% in 1 month while oil went up more than 15%, from 1983-present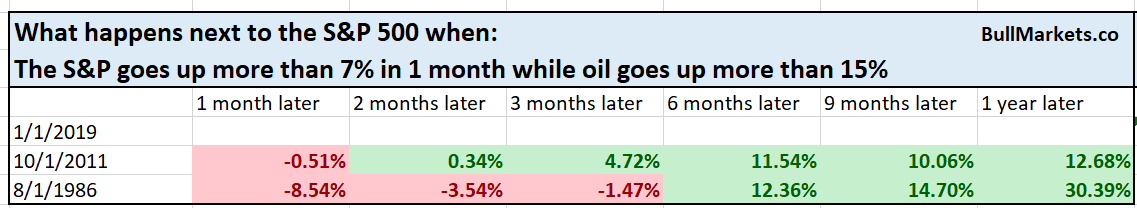
As you can see, both cases were quite long term bullish. Let’s relax the parameters so that we obtain a few more sample cases.
Here’s what happens next to the S&P 500 when the S&P 500 goes up more than 5% in 1 month while oil goes up more than 15%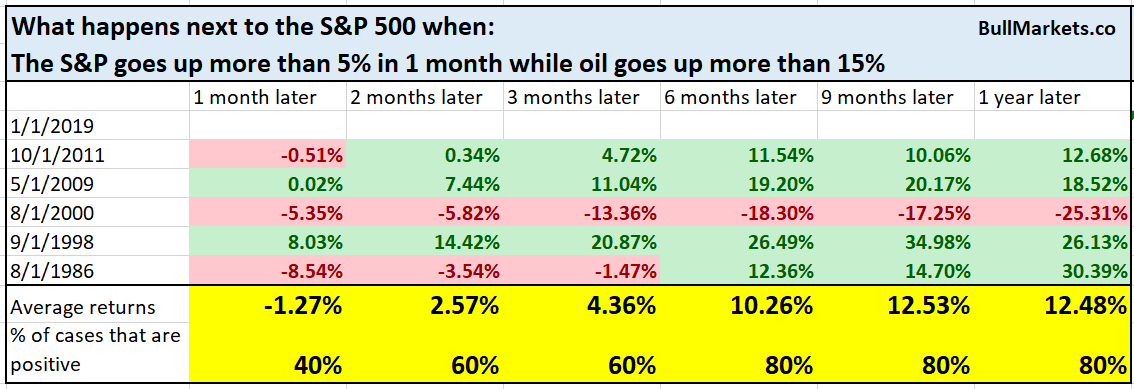
Once again, usually long term bullish, with the exception of 2000.
What makes 2000 different from today?
- In 2000, the USD was going up.
- Today, the USD is going down
If you exclude the rising USD cases, this is what the same study looks like.

Overbought
As the stock market keeps going up, various indicators are starting to show “overbought”
For example, the S&P 500 is now more than 1 standard deviation above its 50 day moving average, for the first time since October 2018.

Here are similar cases, and what the S&P 500 did next
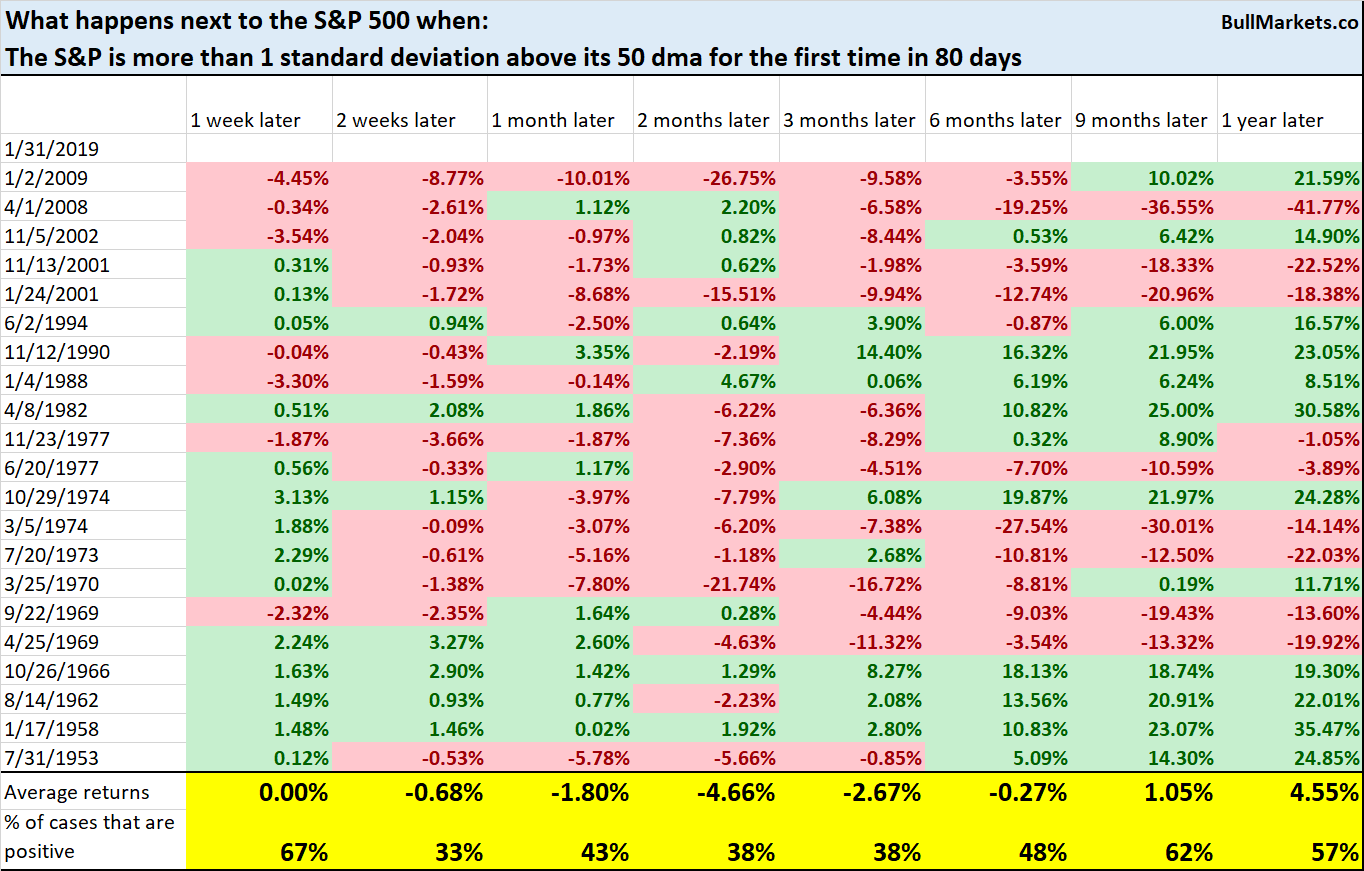
Once again, you can see that the S&P 500 tends to fall in the short term. These “crash and rally” patterns are usually (but not always) followed by a retest.
RWR
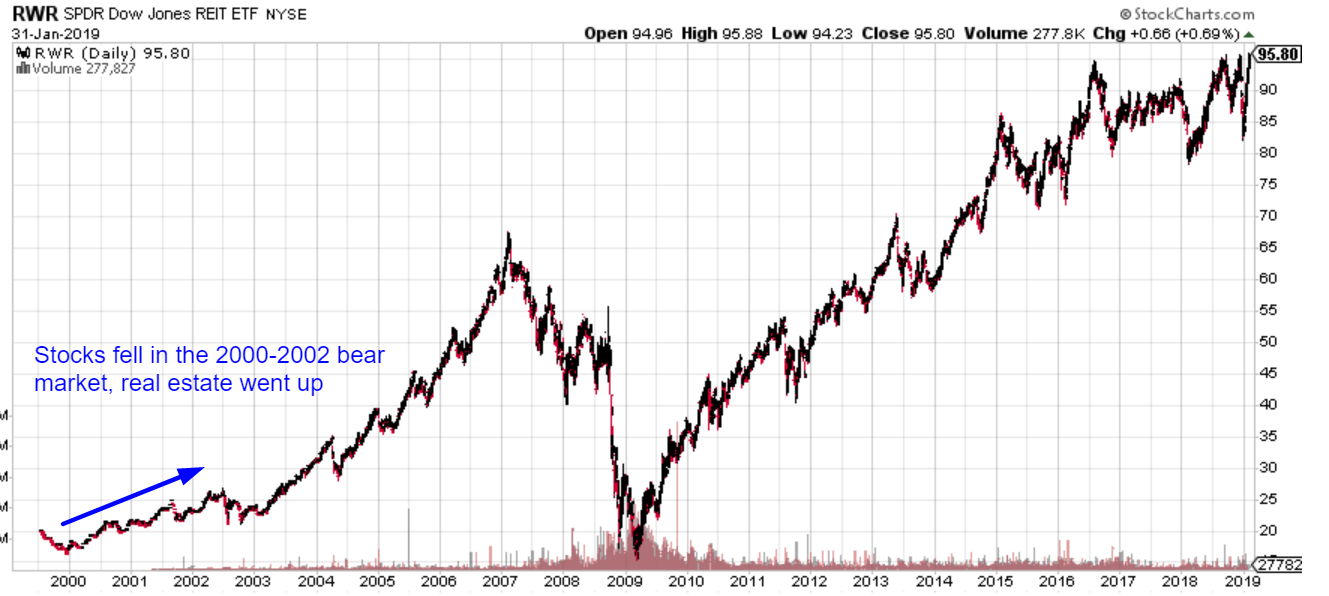
One of the most notable things right now is how strong the real estate sector (excluding homebuilders) has been. RWR is an REIT ETF.
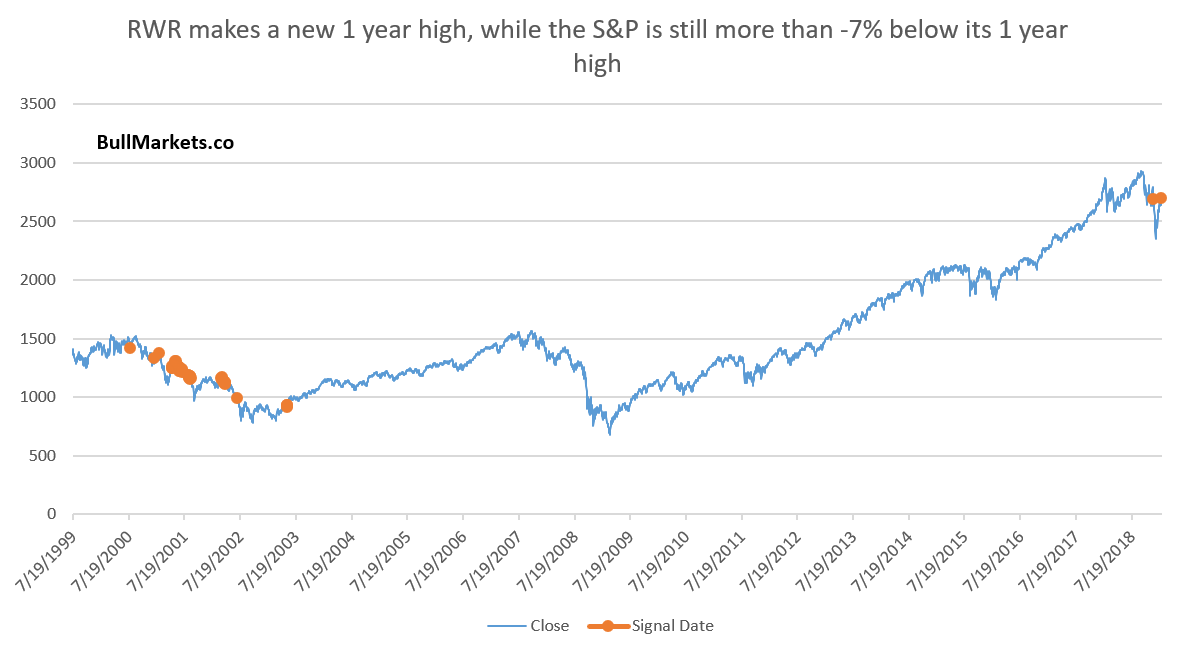
It just made a new high, while the S&P 500 is still far below its all-time highs.

This is particularly interesting, because it’s exactly what happened in the 2000-2002 bear market. Stocks sank, but real estate did well.
Here’s what happens next to the S&P 500 when RWR makes a 1 year high, while the S&P 500 is still more than -7% below its 1 year high
*Data from 2000-present

As you can see, all of this occurred during the 2000-2002 bear market.
While this is a small long term bearish factor for the stock market, I think there’s a more important conclusion to draw
I think the next bear market will be more like 2000-2002 than 2007-2009:
- A big bear market that far exceeds 20%, but a shallow recession.
- The bear market will go down in multiple waves, as opposed to 1 mega-crash like in 2008
- Real estate will outperform.
- Systematic risks in the U.S. today are not as bad as it was in 2008. The banking sector was much stronger.
Oil surge
As we already mentioned, oil has surged over the past month.
Here’s what happens next to oil when it goes up more than 15% in 1 month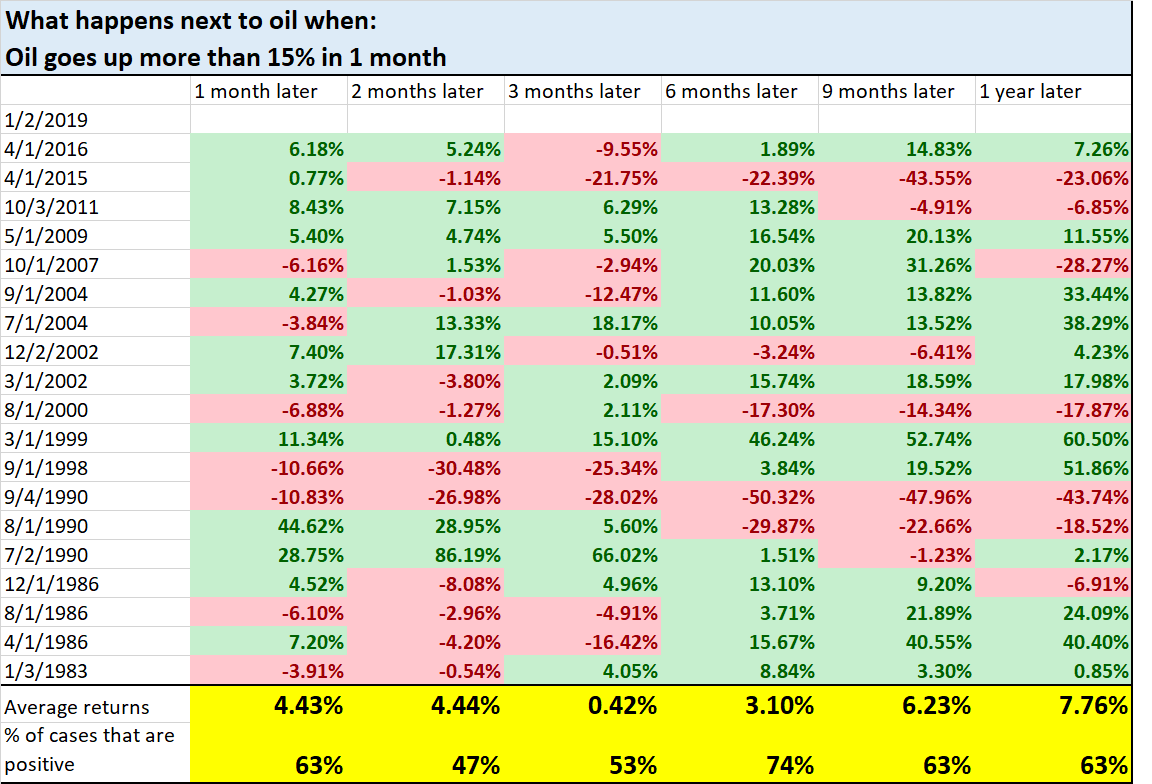
As you can see, oil has a bullish lean 6 months later
AAII divergence
While stocks have risen, sentiment has turned more bearish. It seems that a lot of people are looking for a pullback/retest
Last week, the stock market went up while AAII Bulls went down

The same divergence between price and sentiment happened 2 weeks ago.
Here’s what happens next to the S&P 500 when at least 2 of the past 3 weeks have seen the S&P 500 go up more than 1.5% while AAII Bulls % fell by more than -4%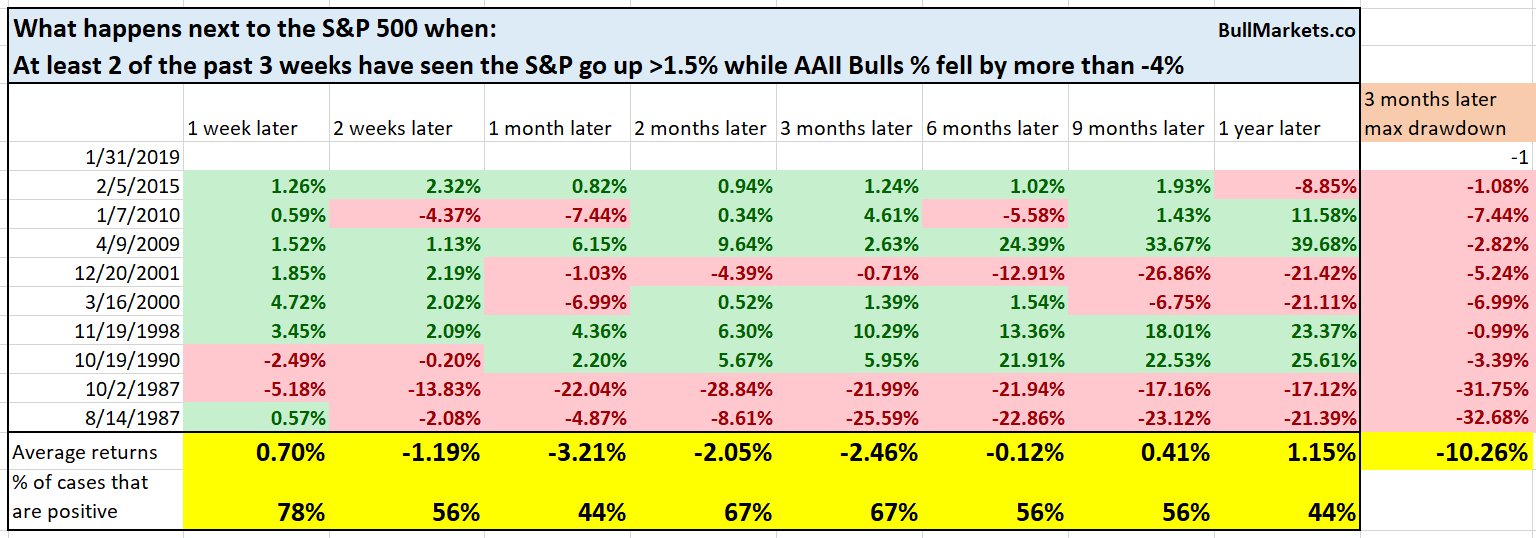
The stock market’s forward returns are mostly random. HOWEVER, you can see that all the historical cases occured after a 15%+ decline. It seems that in every 15%+ decline, people are expecting a crash, rally, and pullback/retest.
The median 3 month later drawdowns are large.
This “crash, rally, pullback/retest” pattern seems to be self-fulfilling.
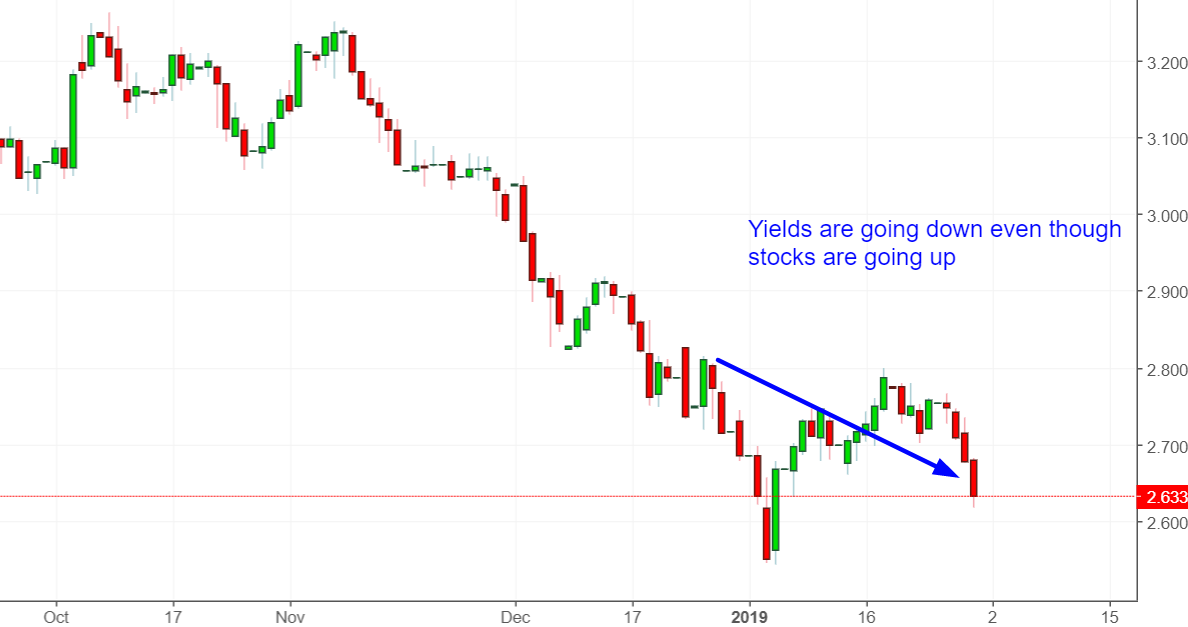
10 year yield
While stocks have gone up, the 10 year yield has gone down. This is uncommon. After stock market crashes (in which yields usually go down), stocks and yields will often go up together.
Here’s the 10 year Treasury yield
Here’s what happens next to the S&P 500 500 when TNX (10 year yield) falls more than -5% while the S&P 500 rises more than 9% over the past 25 days
*Data from 1962-present

The stock marekt’s short-medium terms are no different from random, but it’s long term returns are more bullish than random.
Dow
The Dow closed above its 200 dma on Wednesday, after being more than -10% below its 200 dma.
Is this a “breakout”?
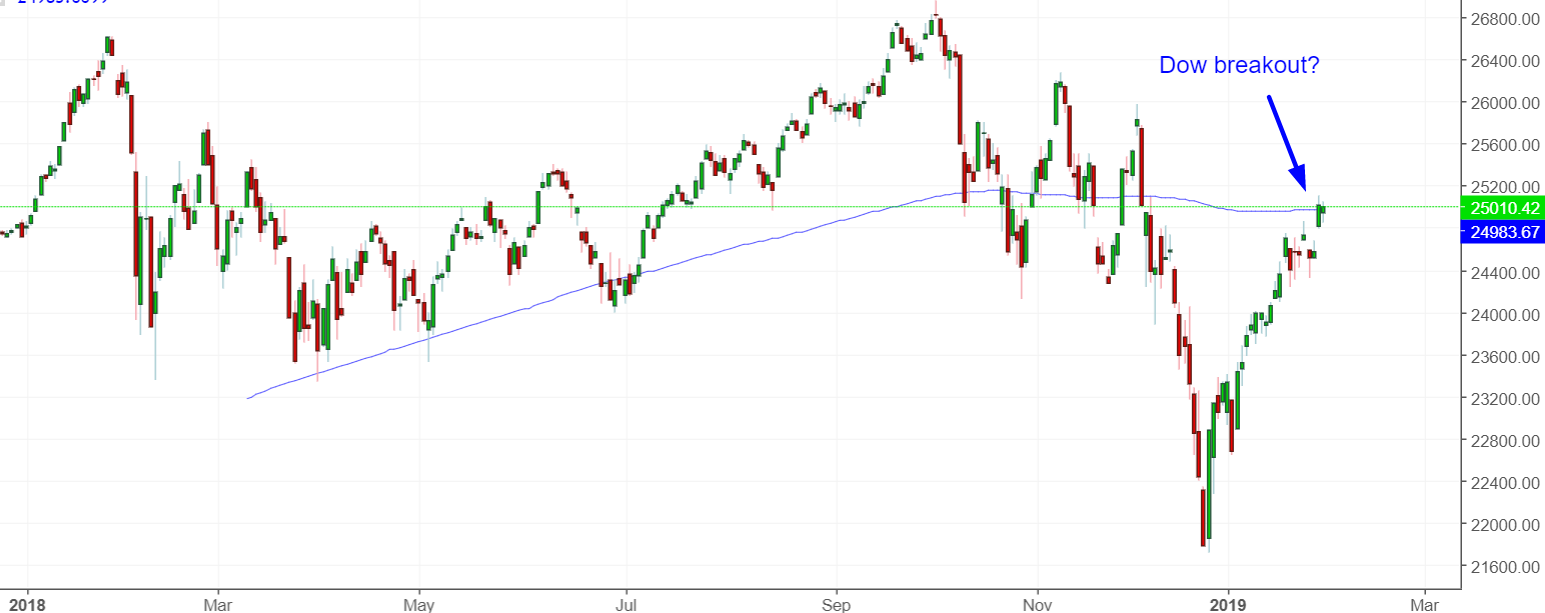
Here are similar historical cases, and what the Dow did next
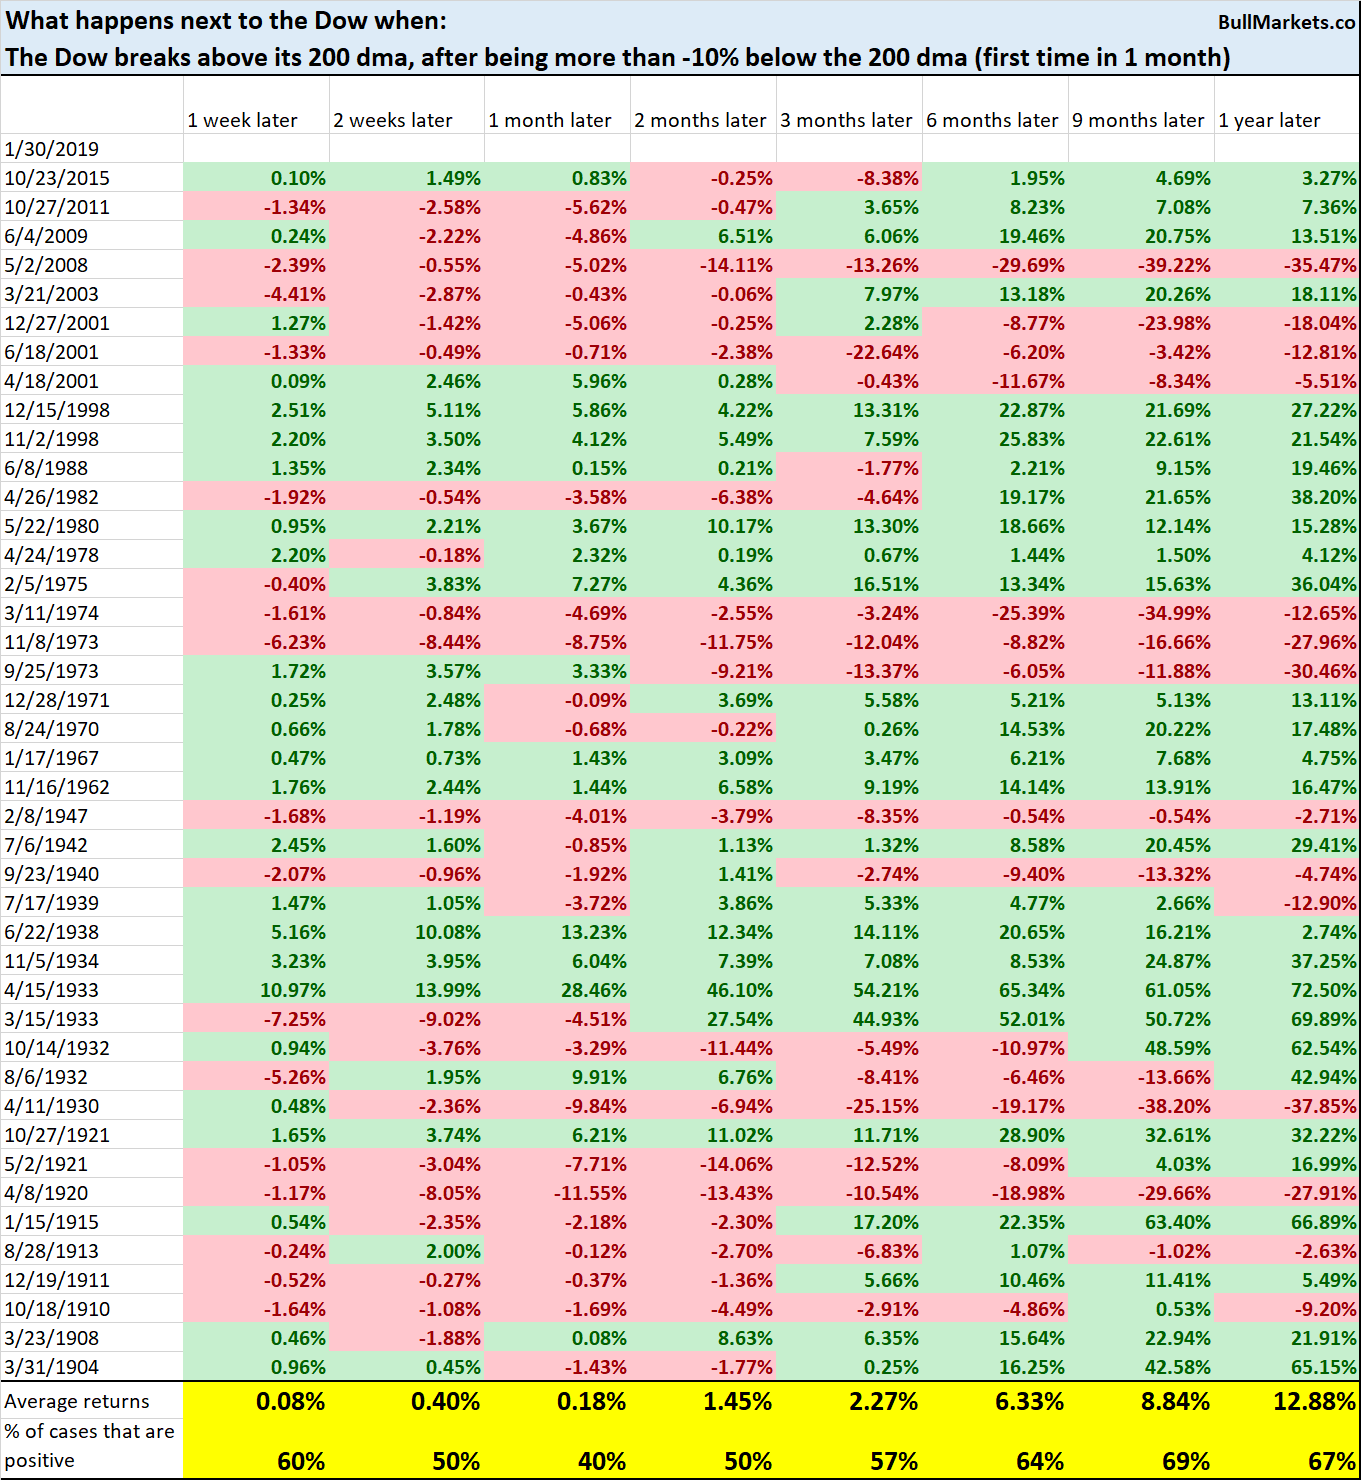
Forward returns are mostly random, although there is a small bearish lean 1 month later.
Click here for yesterday’s market study
Conclusion
Here is our discretionary market outlook:
- The U.S. stock market’s long term risk:reward is no longer bullish. This doesn’t necessarily mean that the bull market is over. We’re merely talking about long term risk:reward. Long term risk:reward is more important than trying to predict exact tops and bottoms.
- The medium term direction (i.e. next 3-6 months) is neutral. Some market studies are medium term bullish while others are medium term bearish
- The stock market’s short term has a bearish lean due to the large probability of a pullback/retest. Focus on the medium-long term (and especially the long term) because the short term is extremely hard to predict.
Goldman Sachs’ Bull/Bear Indicator demonstrates that while the bull market’s top isn’t necessarily in, risk:reward does favor long term bears.
