
Advance Auto Parts Inc. (NYSE:AAP) reported a 16.3% decrease in adjusted earnings to $1.90 per share in the second quarter (ended Jul 16, 2016) of fiscal 2016 from $2.27 earned in the prior-year quarter. The figure also missed the Zacks Consensus Estimate of $2.13. Adjusted net earnings declined 15.9% to $141 million from $167.6 million in the second quarter of fiscal 2015.
Revenues dropped 4.8% year over year to $2.26 billion but surpassed the Zacks Consensus Estimate of $2.24 billion. The year-over-year decline in the top line was due to a fall in comparable store sales, store closures in 2015 and the effect of Carquest consolidations. Comparable store sales fell 4.1% in the reported quarter as against 1% growth recorded a year ago.
Gross profit dropped to $1.01 billion or 44.8% of sales in the reported quarter from $1.09 billion or 45.9% of sales a year ago. The decrease in gross profit margin can be attributed to supply chain expense stemming from a decline in comparable store sales and higher supply chain operating expenses.
Comparable selling, general and administrative (SG&A) expenses totaled $767.1 million or 34% of sales in the quarter under review, compared with $801.8 million or 33.8% of sales in second-quarter fiscal 2015. The decrease in SG&A resulted from continued fixed cost deleverage due to comparable store sales decline and higher self-insurance expense.
Comparable operating income fell 14.8% to $243.1 million from $285.5 million in the prior-year quarter. Operating margin was 10.8% versus 12% a year ago.
ADVANCE AUTO PT Price, Consensus and EPS Surprise
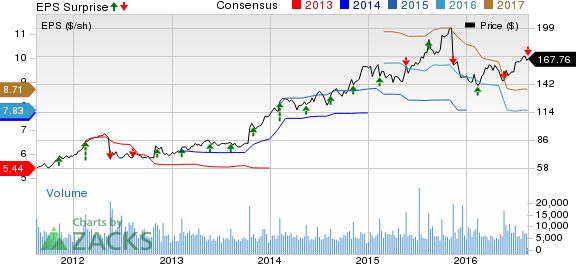
ADVANCE AUTO PT Price, Consensus and EPS Surprise | ADVANCE AUTO PT Quote
Dividend
On Aug 9, 2016, the board of directors of Advance Auto Parts declared a regular quarterly dividend of 6 cents per share, payable on Oct 7, to stockholders on record as of Sep 23, 2016.
Financial Position
Advance Auto Parts had cash and cash equivalents of $104.8 million as of Jul 16, 2016, reflecting an increase from $90.8 million as of Jan 2, 2016. Total long-term debt was $1.17 billion as of Jul 16, 2016, compared with $1.21 billion as of Jan 2, 2016.
During the 28-week period ended Jul 16, 2016, operating cash flow was $192.9 million compared with $330.8 million in the year-ago period. Free cash flow in the said period amounted to $54.9 million compared with free cash flow of $216.3 million in the prior-year period. Capital expenditures amounted to $137.9 million compared with $114.5 million a year ago.
Store Update
As of Jul 16, 2016, the company’s total store count was 5,192, including 126 Worldpac branches. Advance Auto Parts served roughly 696 independently owned Carquest stores as of that date.
Zacks Rank
Advance Auto Parts currently carries a Zacks Rank #4 (Sell).
Better-ranked automobile stocks include The Goodyear Tire & Rubber Company (NASDAQ:GT) , Fox Factory Holding Corp (NASDAQ:FOXF) and Gentex Corp. (NASDAQ:GNTX) . All the three stocks hold a Zacks Rank #2 (Buy).
Want the latest recommendations from Zacks Investment Research? Today, you can download 7 Best Stocks for the Next 30 Days.Click to get this free report >>
ADVANCE AUTO PT (AAP): Free Stock Analysis Report
GENTEX CORP (GNTX): Free Stock Analysis Report
GOODYEAR TIRE (GT): Free Stock Analysis Report
FOX FACTORY HLD (FOXF): Free Stock Analysis Report
Original post
Zacks Investment Research