Pop Quiz! You just received your quarterly statement from the company that manages your 401(k). Which result would you prefer?
A) Your portfolio is up 1.22% for the quarter.
B) Your portfolio is up 4.97%* for the quarter.
Well, that's certainly a no-brainer question. You'd definitely choose option B.
However, buried in the fine print of the document for option B is the footnote for that little asterisk:
*Compounded Annual Percent Change
So this was a trick quiz question! The two answers are identical. To two decimal places, the quarter-over-quarter gain of 1.22% becomes 4.97% if we state it as the compounded annual percent change.
Of course, in the real world, no investment company would issue a 401(k), IRA or any other account statement reporting your quarterly returns at a compounded annual rate.
But that's exactly the way the US Department of Commerce, via the Bureau of Economic Analysis, reports quarterly GDP. Here is the opening of the December 23, 2014 report for Third Quarter GDP:
Real gross domestic product -- the value of the production of goods and services in the United States, adjusted for price changes -- increased at an annual rate of 5.0 percent in the third quarter of 2014....
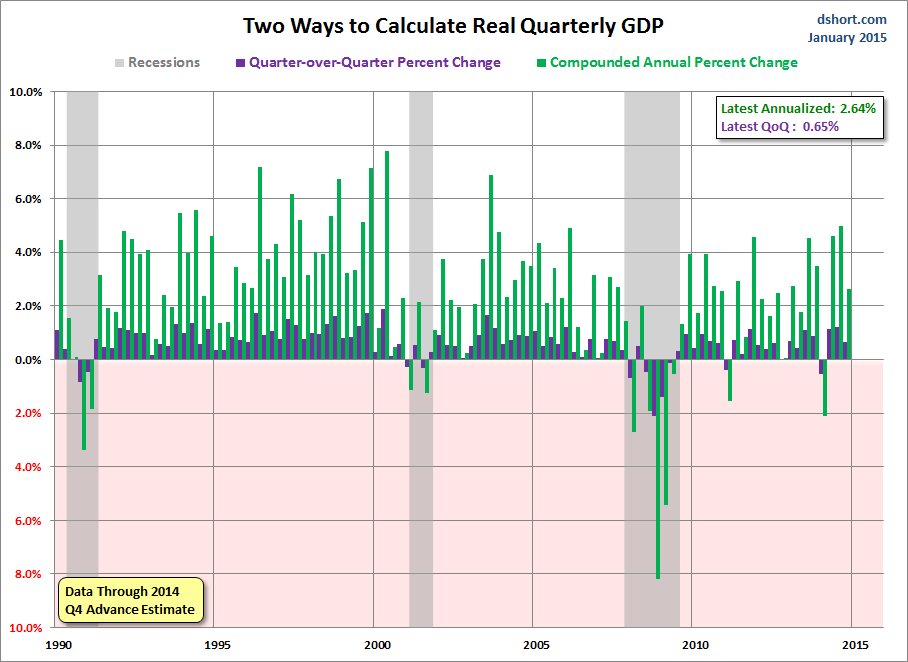
The 5.0 percent was actually 4.97% (answer B in our quiz question) rounded to one decimal. The quarter-over-quarter change was 1.22% (answer A).
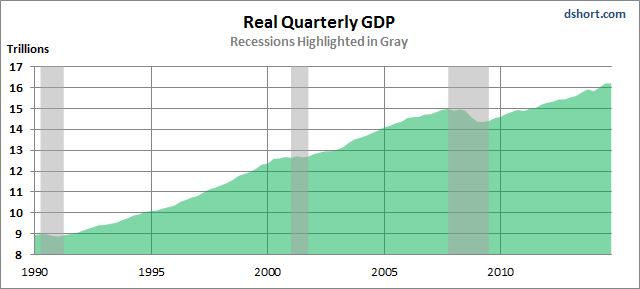
Here's a snapshot of real quarterly GDP over the past 25 years.

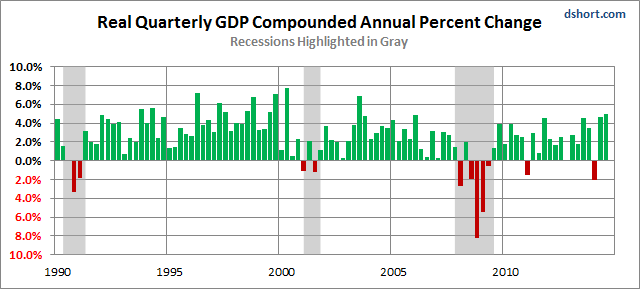
Here is a column chart showing the BEA's preferred annualized representation.

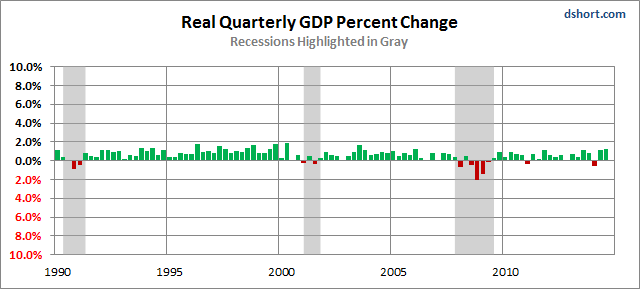
Here is the same data with the more intuitive quarter-over-quarter percent change. Note that I've kept the same vertical axis as the chart above to illustrate the rather stunning difference between the two.

Here's an even better way to illustrate the difference with a side-by-side comparison.

Why does the BEA calculate GDP by compounding the quarterly percent change at annual rates? They do it "For ease of comparison". They explain their rationale here. In a nutshell, it's a technique that's supposed to help you compare the latest quarterly growth with the previous annual growth.
My personal view is that quarterly real GDP should be stated as the percent change from the previous quarter, the way most countries around the world represent their GDP. My suspicion is that the key driver for using the compounded data is the preference for bigger numbers: "Quarterly GDP was up 5 percent!" instead of "Quarterly GDP was up 1.2%".
Consider this: Since the inception of quarterly GDP in 1947, the real quarterly number has been positive 84.9 percent of the time (270 quarters, 229 of which were positive and 41 negative). So the upside advantage of what amounts to "psychological inflation" of economic growth substantially outweighs the downside risk of increased psychological deflation from compounding the negative numbers.
Commerce thrives on optimism, and the inherent instinct is captured in the immortal words of Johnny Mercer's Ac-Cent-Tchu-Ate the Positive:
