Get 40% Off
💰 Buffett reveals a $6.7B stake in Chubb. Copy the full portfolio for FREE with InvestingPro’s Stock Ideas toolCopy Portfolio

A Whole New World: DJT, SPX, RUT, NAS, NDX, Dow

Published 03/27/2018, 11:50 PM
Updated 07/09/2023, 06:31 AM
US500
-
DJI
-
US2000
-
TSLA
-
IXIC
-
DJA
-
META
-

After the huge run-up on Monday, I was deathly concerned that we were in for another month-long grind higher, just like we experienced from February 9th to March 9th. Tuesday’s tumble helped lay that concern to rest.

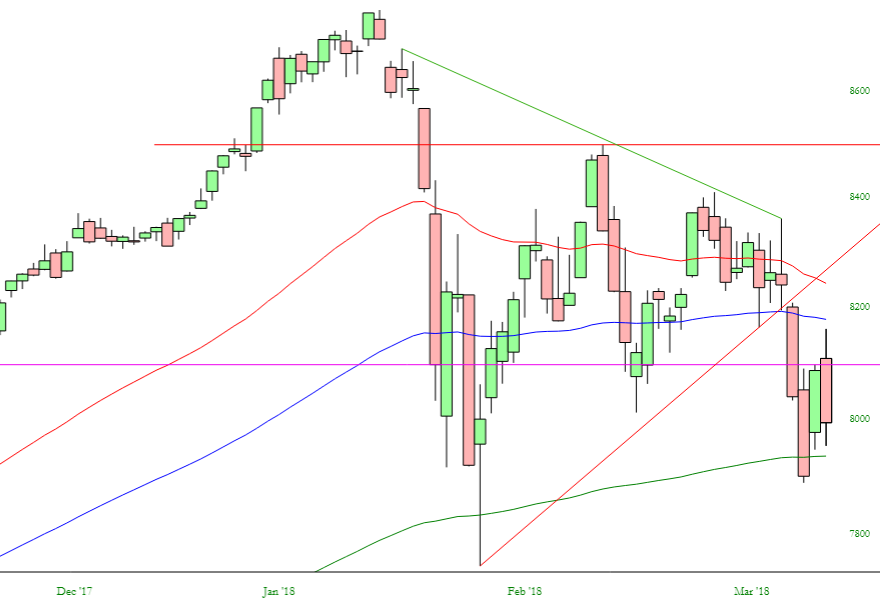
Let’s just take another look at some big indexes and what they tell us. Let’s first examine the Dow Jones Composite.
Dow Comp

What jumps out at me is what’s on the left side of the chart versus what’s on the right side. What do you see on the left? Boredom. Minuscule daily ranges. An unending grind higher, day after day. Dullsville.

How about on the right? Dynamism. Volatility. Huge moves. And a general downtrend.

I guess no one will be surprised to read that I greatly prefer what’s on the right. The stuff on the left sucked.

You’ll also notice that, slowly but surely, the moving averages and tipping lower, plus they are doing a yeoman’s job hemming in the price activity.

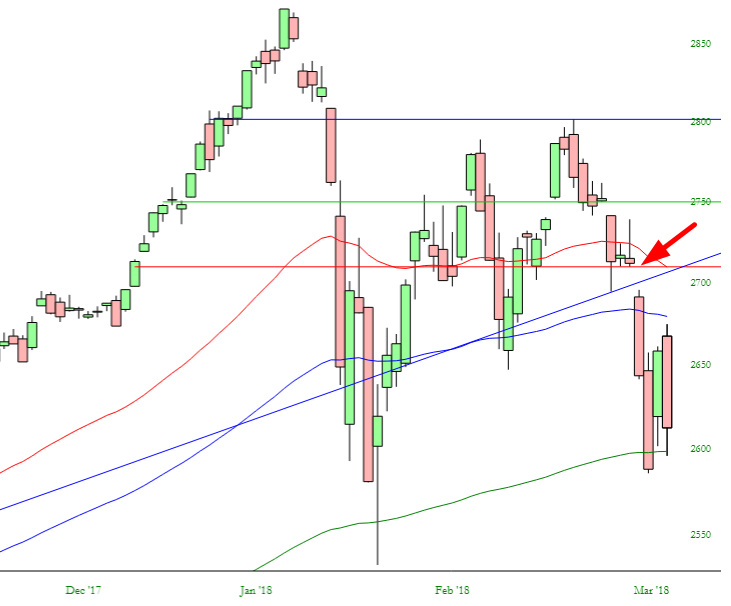
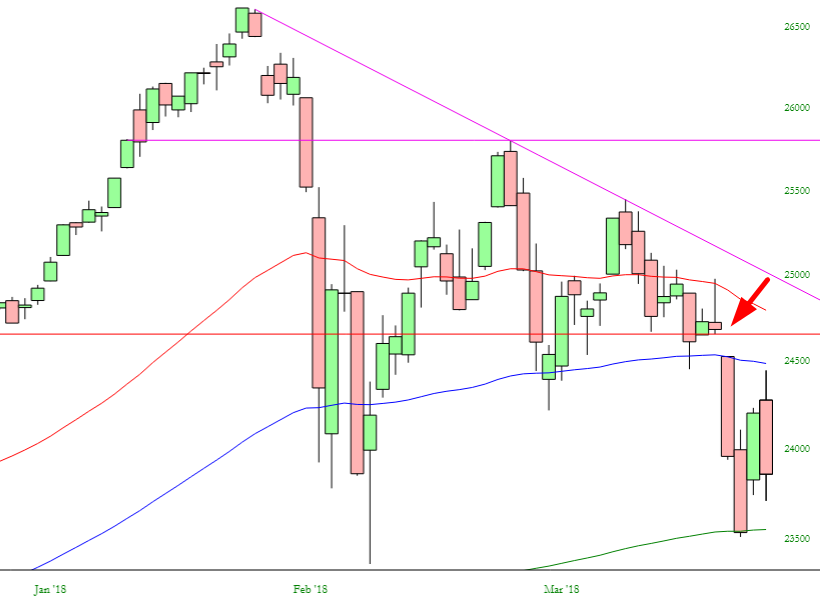
Looking at the S&P 500, below, you can see how we didn’t even get within spitting distance of the Wednesday/Thursday gap (red arrow), and, importantly, we created a monster of a bearish engulfing pattern today. There are only two trading days left this quarter, and in spite of nothing important on the economic calendar, they could be exciting ones.
S&P 500 Chart

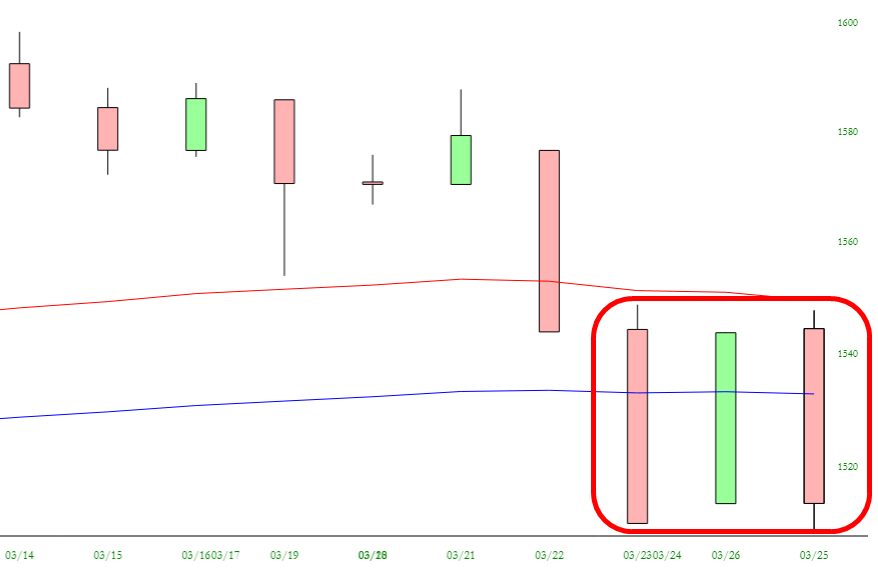
The Russell 2000 is in a weird state. I’ve zoomed in close on recent activity. It seems that the small caps simply made it their purpose in life to piss everyone off. Just look at how range-bound it is!
3rd party Ad. Not an offer or recommendation by Investing.com. See disclosure here or remove ads .

RUSS Chart

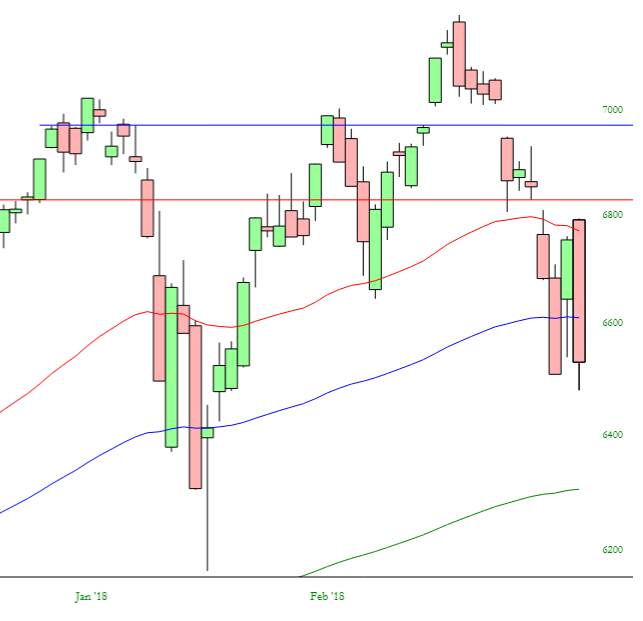
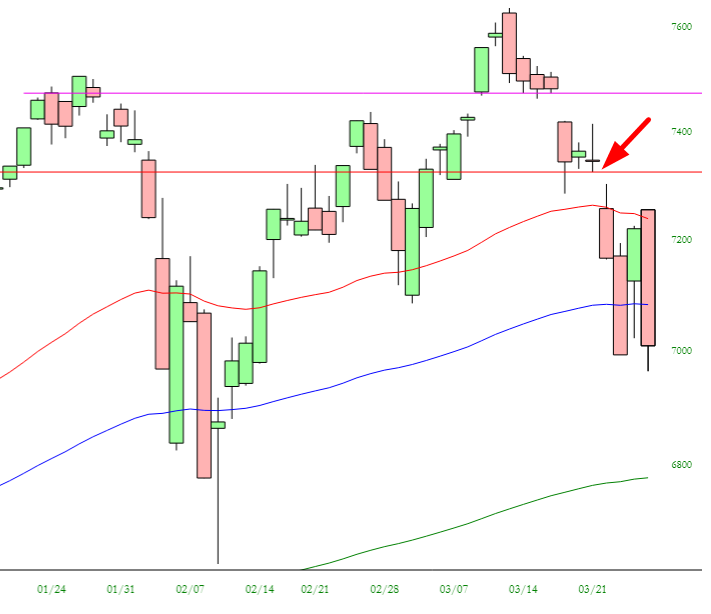
Not so with the NASDAQ, however. As leaders such as Nvidia and Tesla (NASDAQ:TSLA) have their high-tech nuts blown off, the entire tech complex is rolling over (led by Facebook (NASDAQ:FB), which has lost an incredible ONE QUARTER of its entire market cap only since last month began). Check out the king-sized bearish engulfing pattern on the NASDAQ today:
Nasdaq 100 Chart

Lastly, on the Dow, I’m more convinced than ever that the ultimate high has been set as of January 26th. We remain thousands of points off the high, and I think it will be a long, long time before we ever see such levels again. The Wednesday/Thursday gap remains key across the board.
DOW Chart

NASDAQ Composite:

NASDAQ COMP

Latest comments

Risk Disclosure: Trading in financial instruments and/or cryptocurrencies involves high risks including the risk of losing some, or all, of your investment amount, and may not be suitable for all investors. Prices of cryptocurrencies are extremely volatile and may be affected by external factors such as financial, regulatory or political events. Trading on margin increases the financial risks.
Before deciding to trade in financial instrument or cryptocurrencies you should be fully informed of the risks and costs associated with trading the financial markets, carefully consider your investment objectives, level of experience, and risk appetite, and seek professional advice where needed.
Fusion Media would like to remind you that the data contained in this website is not necessarily real-time nor accurate. The data and prices on the website are not necessarily provided by any market or exchange, but may be provided by market makers, and so prices may not be accurate and may differ from the actual price at any given market, meaning prices are indicative and not appropriate for trading purposes. Fusion Media and any provider of the data contained in this website will not accept liability for any loss or damage as a result of your trading, or your reliance on the information contained within this website.
It is prohibited to use, store, reproduce, display, modify, transmit or distribute the data contained in this website without the explicit prior written permission of Fusion Media and/or the data provider. All intellectual property rights are reserved by the providers and/or the exchange providing the data contained in this website.
Fusion Media may be compensated by the advertisers that appear on the website, based on your interaction with the advertisements or advertisers.
© 2007-2024 - Fusion Media Limited. All Rights Reserved.