
As the USD index refuses to do anything directional, it’s worth noting that all of the G10 currency trading action lately, both in terms of trading ranges and trends, has been in the JPY crosses and the commodity dollars versus the European majors, especially GBP. The commodity dollars in particular are at relative extremes versus one another and versus the broader market as we scratch around for what is driving the action here.
New Zealand dollar
The story here is rather simple — it’s the hottest economy among the AA or better-rated countries in terms of growth and the prospects of the central bank removing accommodation. The market is enthusiastically piling into the kiwi carry trade, lately probably funding it with JPY, but perhaps also in US dollars and even Canadian dollars (as the Bank of Canada has kept rate hike expectations at nil lately). Still, it is interesting that the little commodity dollar that could has been able to rally strongly on a day when European equities are having their weakest day in recent memory. It will likely take a combination of weaker numbers from New Zealand or an ugly continuation of today’s risk-off move to derail this currency’s strength — that and/or a stronger message from the Fed on a tapering of asset purchases, which tends to put a pinch on the less liquid currencies. The kiwi is overvalued and its housing bubble will eventually end in an eventual hangover, but its momentum remains impressive until proven otherwise.
Chart: AUDNZD
The path of the kiwi and the Aussie have diverged to an impressive degree this year. There may not be much more to eke out of this trend from a valuation perspective (the 1.0500 area has been the bottom of the range a number of times since the 1980's). Also, if risk goes from the “wildly on” of late to decidedly off, the kiwi is one of the least liquid currencies in the G10 and would likely correct from extreme strength to extreme weakness as it should be one of the highest beta currencies in such circumstances. 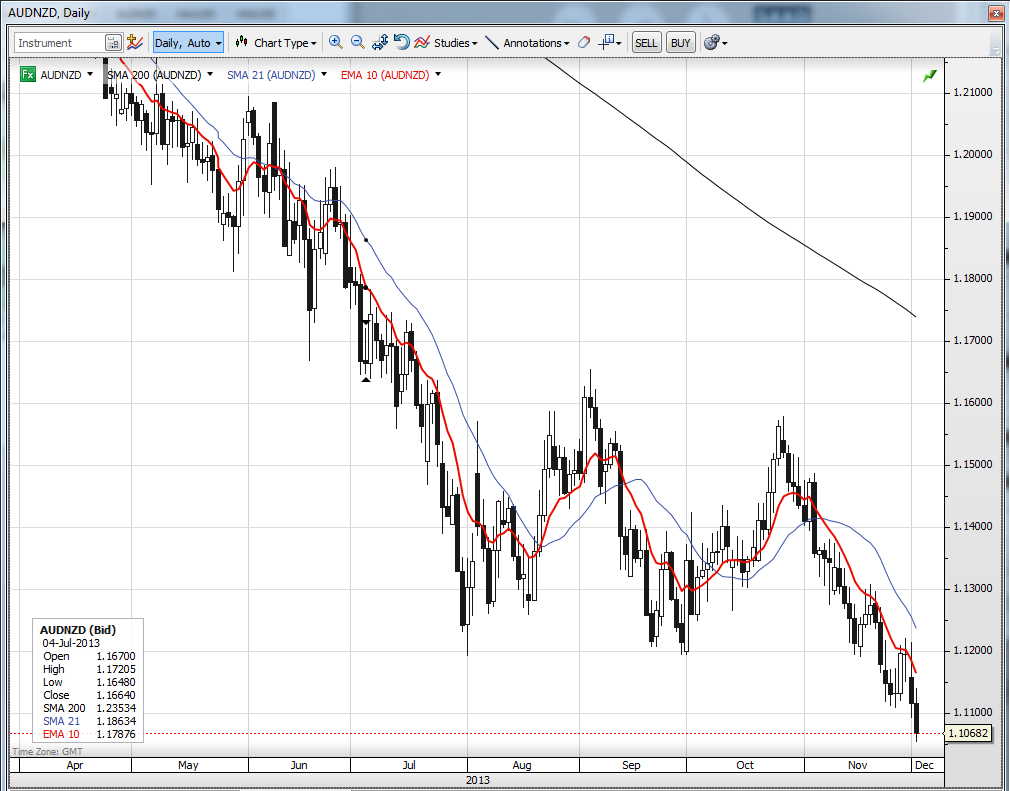
Australian dollar
Until the last couple of days of CAD weakness, the AUD was the weakest of the weak in the G10, driven by a central bank that has enthusiastically welcomed the currency’s weakness and is happy to continue to complain it is too strong in the hope that a weaker Aussie can provide a lift that it doesn’t want to provide by cutting rates further — unless it absolutely has to. The idea the China is trying to change its style of growth away from the commodity intensive infrastructure/property building of the past and generally weak commodity markets stir up a strong headwind for the currency. Still, lately the market is beginning to anticipate rate hikes again, if still relatively far out on the curve. We’ll need to see weaker Aussie fundamentals and global risk-off to get a strong resumption of the selling from current levels in broader terms. There could be a risk of some short-lived AUD strength if the European Central Bank comes out with new easing measures this week, as this could hit the EURAUD for a few rounds after EURAUD longs have been a popular trade this year.
Chart: GBPAUD
It has been a popular trade to short the Aussie versus the major European currencies in recent weeks and months, and the impressive UK numbers and shift away from quantitative easing by the Bank of England are seeing the market drive this one impressively higher as the Reserve Bank of Australia continues to talk down its currency and as the market plays the anti-commodity theme. 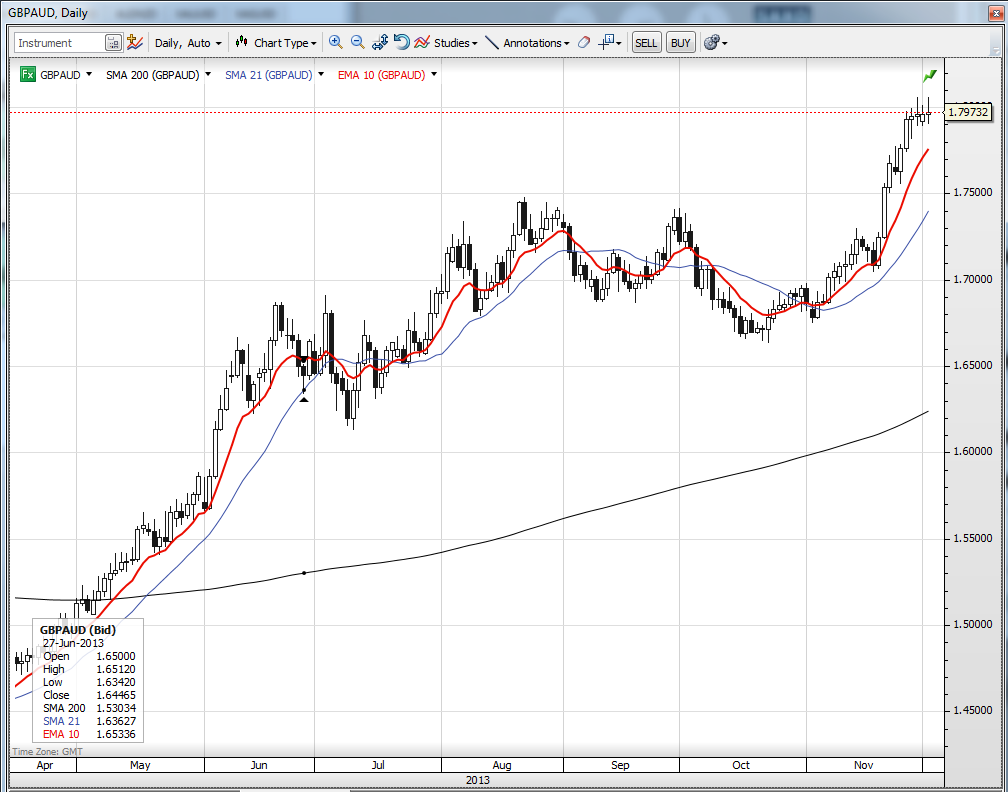
Canadian dollar
The Bank of Canada (next meeting up tomorrow, Wednesday, December 4) has switched to very dovish rhetoric on the path of rates, removing the mention of an eventual tightening and lowering its outlook for the Canadian economy. It would like a weaker currency to help bring balance back to the Canadian economy, which has suffered more than a bit of Dutch disease in recent years and where a private debt and housing bubble of large proportions has inflated. We’ve just witnessed a technical break in the USDCAD pair of the 1.0600 area and the highest daily close in over three years. This is a real break until proven otherwise and will be confirmed if the pair can maintain altitude after the Bank of Canada meeting and the key US data points over the remainder of the week.
Chart: USDCAD
A major break for this pair, though one that needs to survive the Bank of Canada meeting tomorrow and the key US data through the end of the week for better confirmation of its validity. 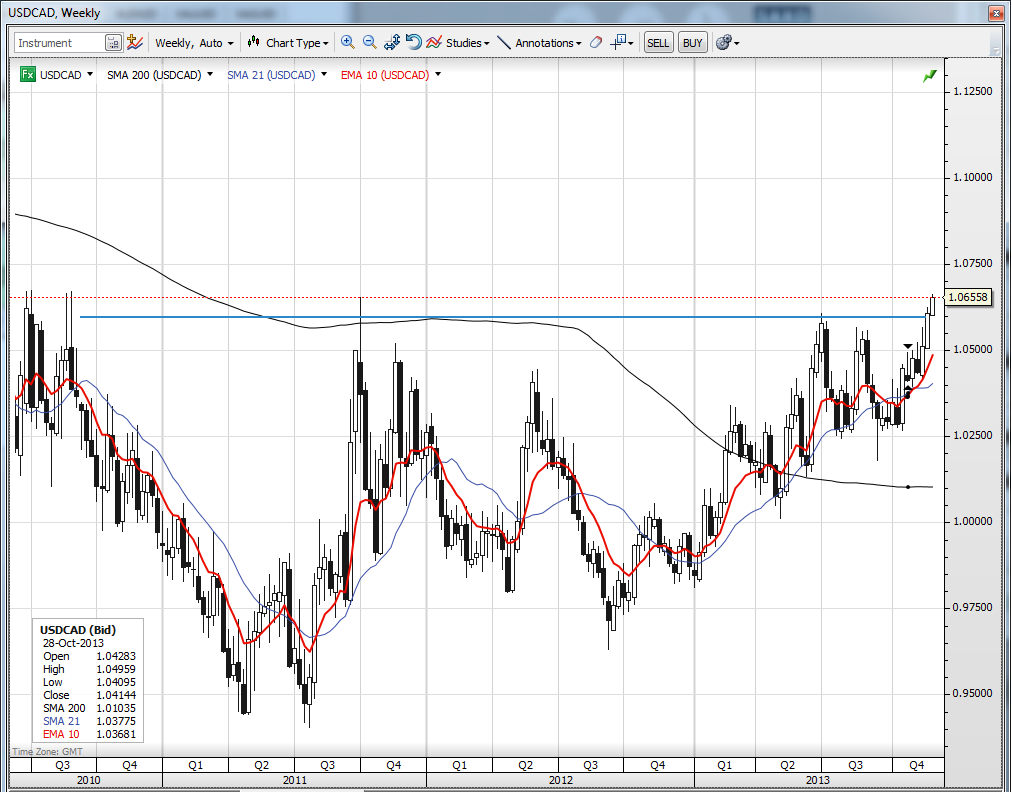
For the year forward and from a longe- term valuation perspective, I would expect that the CAD proves the strongest of the three, with the AUD in the middle of the pack and the NZD bringing up the rear.
- English (UK)
- English (India)
- English (Canada)
- English (Australia)
- English (South Africa)
- English (Philippines)
- English (Nigeria)
- Deutsch
- Español (España)
- Español (México)
- Français
- Italiano
- Nederlands
- Português (Portugal)
- Polski
- Português (Brasil)
- Русский
- Türkçe
- العربية
- Ελληνικά
- Svenska
- Suomi
- עברית
- 日本語
- 한국어
- 简体中文
- 繁體中文
- Bahasa Indonesia
- Bahasa Melayu
- ไทย
- Tiếng Việt
- हिंदी
A Tale Of Three Dollars AUD, CAD And NZD
Published 12/03/2013, 10:31 AM
Updated 03/19/2019, 04:00 AM
A Tale Of Three Dollars AUD, CAD And NZD
3rd party Ad. Not an offer or recommendation by Investing.com. See disclosure here or
remove ads
.
Latest comments
Install Our App
Risk Disclosure: Trading in financial instruments and/or cryptocurrencies involves high risks including the risk of losing some, or all, of your investment amount, and may not be suitable for all investors. Prices of cryptocurrencies are extremely volatile and may be affected by external factors such as financial, regulatory or political events. Trading on margin increases the financial risks.
Before deciding to trade in financial instrument or cryptocurrencies you should be fully informed of the risks and costs associated with trading the financial markets, carefully consider your investment objectives, level of experience, and risk appetite, and seek professional advice where needed.
Fusion Media would like to remind you that the data contained in this website is not necessarily real-time nor accurate. The data and prices on the website are not necessarily provided by any market or exchange, but may be provided by market makers, and so prices may not be accurate and may differ from the actual price at any given market, meaning prices are indicative and not appropriate for trading purposes. Fusion Media and any provider of the data contained in this website will not accept liability for any loss or damage as a result of your trading, or your reliance on the information contained within this website.
It is prohibited to use, store, reproduce, display, modify, transmit or distribute the data contained in this website without the explicit prior written permission of Fusion Media and/or the data provider. All intellectual property rights are reserved by the providers and/or the exchange providing the data contained in this website.
Fusion Media may be compensated by the advertisers that appear on the website, based on your interaction with the advertisements or advertisers.
© 2007-2024 - Fusion Media Limited. All Rights Reserved.