Get 40% Off
💰 Buffett reveals a $6.7B stake in Chubb. Copy the full portfolio for FREE with InvestingPro’s Stock Ideas toolCopy Portfolios

A Reversal In Bullish Investment Sentiment

Published 02/09/2018, 12:58 AM
Updated 07/09/2023, 06:31 AM
US500
-

I have often written that sentiment measures are most valuable at their extremes. Also, they tend to be most representative of potential market turning points when the extreme is at the bearish end of the spectrum. However, in hindsight, it appears recent excessive bullishness for individual investors and institutional investors indicated a cautionary equity market outlook would have been profitable.

The first chart below represents individual investors' bullish sentiment responses as reported weekly by The American Association of Individual Investors. On January 4 of this year, bullish sentiment spiked to near 60% and represents a high level for this reading. About a month later, the 8-period moving average reached near 51%, also a high level for the 8-period average, although the average has exceed 60% in the past.
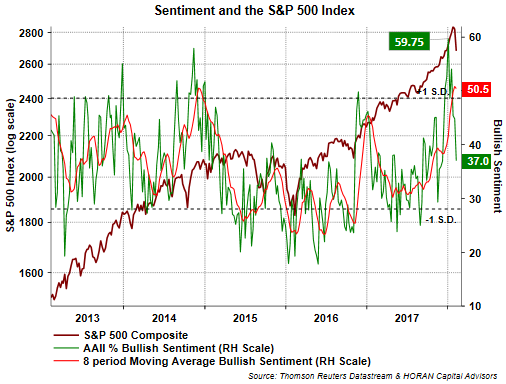
Sentiment And The S&P 500 Index

Also hitting a near term high of 109.4 was the NAAIM Exposure Index Index on December 13, 2017. Subsequent to the institutional manager exposure index high, it has since declined to 56.8% this week.
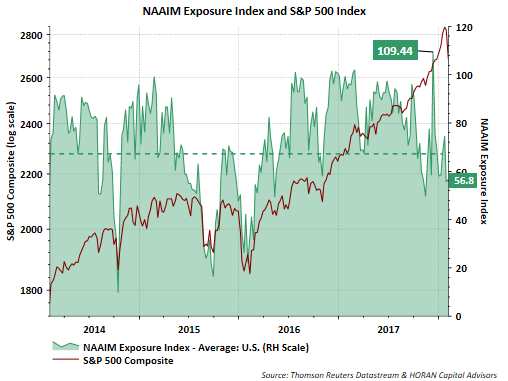
NAAIM Exposure Index And S&P 500 Index

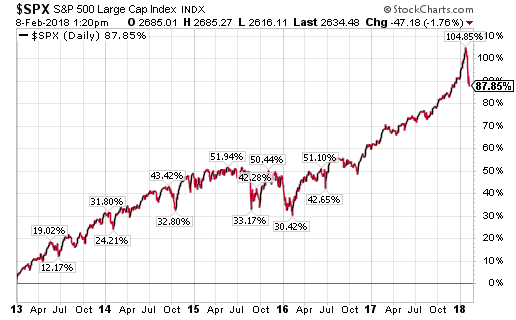
On the heals of these high readings, the equity markets have reversed course and are currently experiencing a more volatile period, which is a more normal function for the markets. No one likes giving back gains for sure, but the below chart shows equity returns remain strong over the course of the last five years. The chart's absence of percentage labels in 2017 is due to virtually no volatility in the index's return. Since February of 2016, the S&P 500 Index has mostly moved in one direction and that is higher.
3rd party Ad. Not an offer or recommendation by Investing.com. See disclosure here or remove ads .

SPX Daily Chart

As we noted in our commentary a few days ago, the market's return to volatility is based on an economic environment that is accelerating at a pace faster than many strategists expected. Importantly, a recession does not seem like a near term outcome; but some stability in interest rates may be necessary to reduce the some of the equity market's recent volatility.
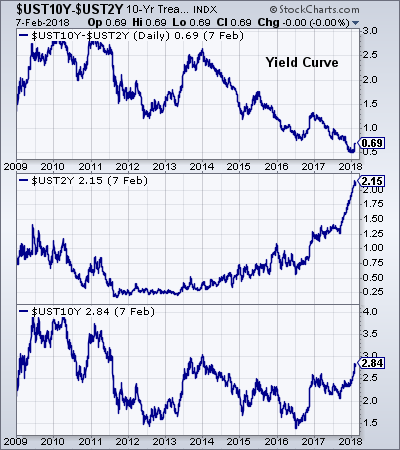
UST10Y-UST2Y Daily Chart

Latest comments

Risk Disclosure: Trading in financial instruments and/or cryptocurrencies involves high risks including the risk of losing some, or all, of your investment amount, and may not be suitable for all investors. Prices of cryptocurrencies are extremely volatile and may be affected by external factors such as financial, regulatory or political events. Trading on margin increases the financial risks.
Before deciding to trade in financial instrument or cryptocurrencies you should be fully informed of the risks and costs associated with trading the financial markets, carefully consider your investment objectives, level of experience, and risk appetite, and seek professional advice where needed.
Fusion Media would like to remind you that the data contained in this website is not necessarily real-time nor accurate. The data and prices on the website are not necessarily provided by any market or exchange, but may be provided by market makers, and so prices may not be accurate and may differ from the actual price at any given market, meaning prices are indicative and not appropriate for trading purposes. Fusion Media and any provider of the data contained in this website will not accept liability for any loss or damage as a result of your trading, or your reliance on the information contained within this website.
It is prohibited to use, store, reproduce, display, modify, transmit or distribute the data contained in this website without the explicit prior written permission of Fusion Media and/or the data provider. All intellectual property rights are reserved by the providers and/or the exchange providing the data contained in this website.
Fusion Media may be compensated by the advertisers that appear on the website, based on your interaction with the advertisements or advertisers.
© 2007-2024 - Fusion Media Limited. All Rights Reserved.