
Good afternoon, dear traders. Today we will take a look at the PCI US/EU, which is a comparative US-EU macroeconomic index. The base part, the (US) is an index of the United States based on the DJI (50%)+Nd100(50%) and the Dow Jones and Nasdaq portfolio with equal weights for capital placement. The quoted part contains the (EU), characterizing the European Union economy - DAX(50%)+EUR(50%). Funds in the quoted part are placed in the German DAX index and the Euro in equal proportions. Note that the base and quoted parts of the PCI are expressed in the USD.
According to the analysis of the main fundamental indicators, we concluded that U.S. economy is recovering faster from the recession in 2008. The reason is the fact that the Fed has created favorable conditions for investment in U.S. economy such as low interest rates and quantitative easing program QE. This led to the reverse process when the investment began to return from emerging markets to developed markets with high pre-crisis growth rates. So the U.S. is leader in the competition for capital investment today. The following table presents the macroeconomic indicators for the U.S. and the EU in 2013 in percentage terms. We see that in all figures of the United States, besides the retail sales, outperform the corresponding figures of European economy. The situation for the latter is complicated due to high unemployment and protests in the southern countries (Greece, Portugal, Spain). The considered processes allow to expect the long-term growth in PCI US/EU, created with the help of the NetTradeX trading platform.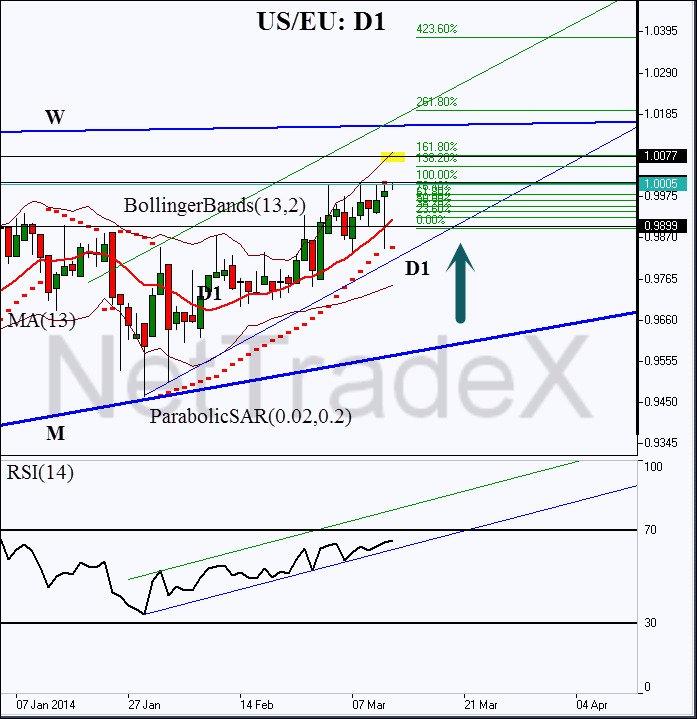 EUR/USD" title="EUR/USD" border="0" height="719" width="697">
The figure shows the daily candle chart of the PCI US/EU relative macroeconomic index. The ParabolicSAR is located below the price and confirms the daily uptrend. There is no contradiction from the RSI(14). Moreover, we see that the price crossed 13-days exponential moving average up and wanders around 1.0005 resistance being ready to punch it up. We recommend to place a pending buy order above the current level and take profits around 161.8% of the Fibonacci target. This goal is advantageous because it is also confirmed by the upper border of the BollingerBands(13,2) channel. The preliminary stop loss can be placed below the local minimum at 0.9899 and moved up behind the ParabolicSAR indicator value.