West Texas Intermediate Crude Oil (WTIC),(CLF), (USO) is the life blood of the US. Fluctuations in its price can destroy our economy or turn it into a powerhouse. And flipping the relationship on its head, an economic crisis can materially impact its price as well.
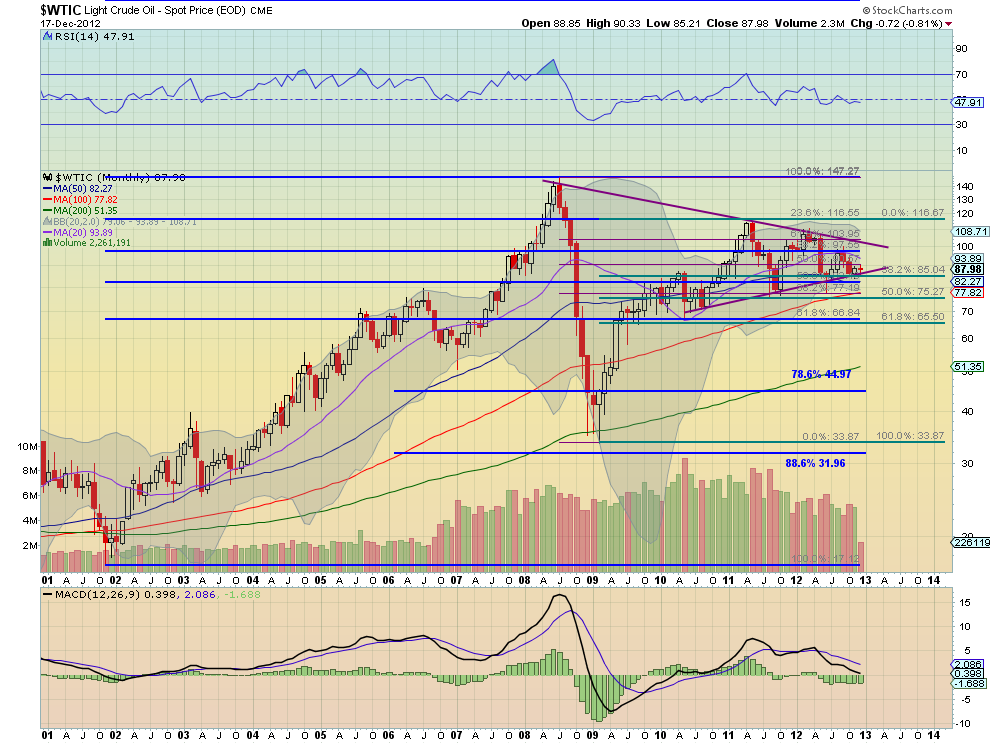
The spike to over $147 per barrel in 2008 was met with a crashing fall during the financial crisis. It recovered quickly and what has it been doing since early 2010? Basically nothing. Lets look closer. The monthly chart below shows a symmetrical triangle tightening around the 88-91 level. The Relative Strength Index (RSI) is also creating a tightening grip on the mid-line.
Layering on the Fibonacci retracements from the last 3 biggest moves shows a lot of congestion between 75.27 and 103.95, giving some reasoning for the consolidation (you can click on the chart to make it larger and see the layers). There is a real divergence in this chart with that RSI holding in bullish territory and the Moving Average Convergence Divergence indicator (MACD) negative.
Another reason to move sideways. The important takeaway from this timeframe is that there is a $36 move tied up in the triangle pattern once it does break. The rising Simple Moving Averages (SMA) give the edge to the upside in a tie breaker. 
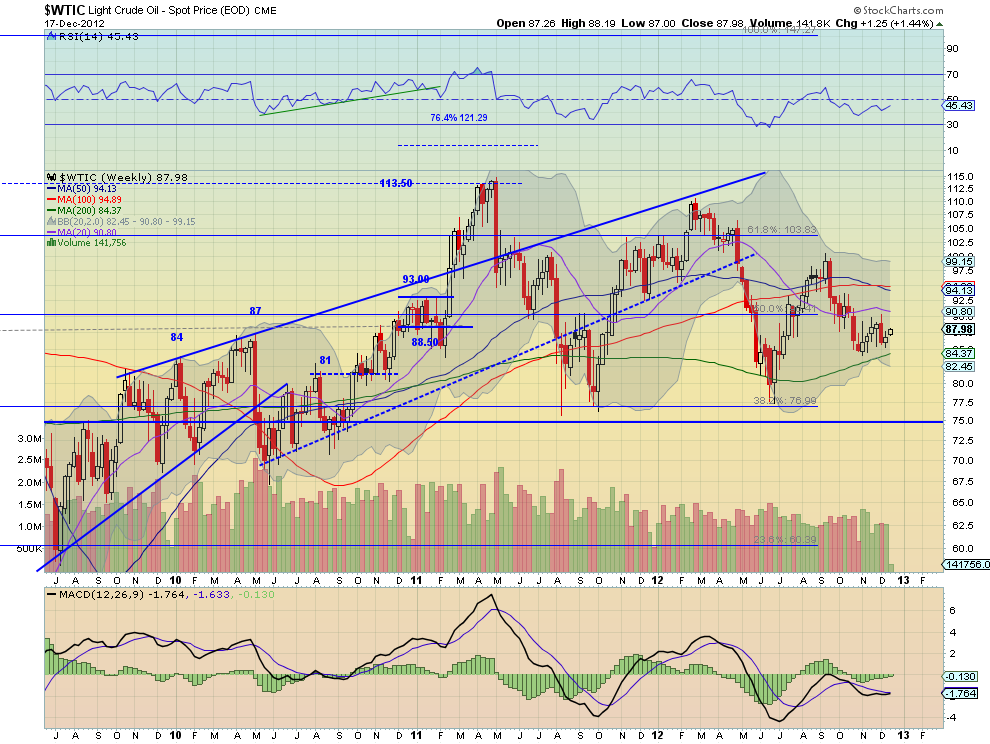
But moving in to the weekly view above does not really clear anything up. The RSI on this timeframe is bearish but tightening on the mid line, with a MACD that is improving. Adding to the confusion, all of the SMA are moving sideways, creating a range with 84 and then 77 to the downside and 90 to the top.
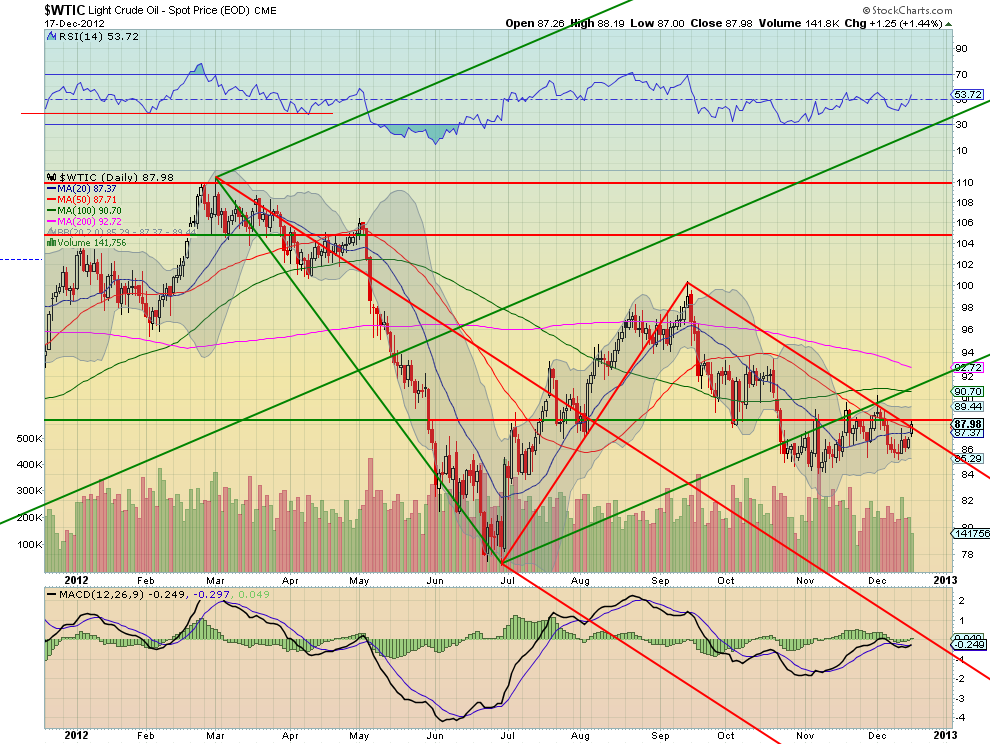
Maybe the daily chart will provide insight. The chart below shows that the Lower Median Line of the bullish (green) Andrew’s Pitchfork is losing control to the Upper Median Line of the bearish (red) Pitchfork. A move and hold over the long-term resistance at 88 would change that back the other way.
There are small signs that this could be happening. The RSI is rising, but still not bullish, and the MACD is crossing to positive, although not very strongly. A move over 91 would provide more certainty to the case for higher prices. But failure at the top of the bearish Pitchfork and a move under 84 will clarify the picture to the downside. Until then, it is range bound.
Disclaimer: The information in this blog post represents my own opinions and does not contain a recommendation for any particular security or investment. I or my affiliates may hold positions or other interests in securities mentioned in the Blog, please see my Disclaimer page for my full disclaimer.
Original post
- English (UK)
- English (India)
- English (Canada)
- English (Australia)
- English (South Africa)
- English (Philippines)
- English (Nigeria)
- Deutsch
- Español (España)
- Español (México)
- Français
- Italiano
- Nederlands
- Português (Portugal)
- Polski
- Português (Brasil)
- Русский
- Türkçe
- العربية
- Ελληνικά
- Svenska
- Suomi
- עברית
- 日本語
- 한국어
- 简体中文
- 繁體中文
- Bahasa Indonesia
- Bahasa Melayu
- ไทย
- Tiếng Việt
- हिंदी
A Long Term View On...Crude Oil
Published 12/19/2012, 01:34 AM
Updated 05/14/2017, 06:45 AM
A Long Term View On...Crude Oil
3rd party Ad. Not an offer or recommendation by Investing.com. See disclosure here or
remove ads
.
Latest comments
Install Our App
Risk Disclosure: Trading in financial instruments and/or cryptocurrencies involves high risks including the risk of losing some, or all, of your investment amount, and may not be suitable for all investors. Prices of cryptocurrencies are extremely volatile and may be affected by external factors such as financial, regulatory or political events. Trading on margin increases the financial risks.
Before deciding to trade in financial instrument or cryptocurrencies you should be fully informed of the risks and costs associated with trading the financial markets, carefully consider your investment objectives, level of experience, and risk appetite, and seek professional advice where needed.
Fusion Media would like to remind you that the data contained in this website is not necessarily real-time nor accurate. The data and prices on the website are not necessarily provided by any market or exchange, but may be provided by market makers, and so prices may not be accurate and may differ from the actual price at any given market, meaning prices are indicative and not appropriate for trading purposes. Fusion Media and any provider of the data contained in this website will not accept liability for any loss or damage as a result of your trading, or your reliance on the information contained within this website.
It is prohibited to use, store, reproduce, display, modify, transmit or distribute the data contained in this website without the explicit prior written permission of Fusion Media and/or the data provider. All intellectual property rights are reserved by the providers and/or the exchange providing the data contained in this website.
Fusion Media may be compensated by the advertisers that appear on the website, based on your interaction with the advertisements or advertisers.
© 2007-2024 - Fusion Media Limited. All Rights Reserved.
