Emerging Market (EEM) have been important to US investors and traders since at least the early 1990s. Touted for their non-correlated growth and diversification, they have also become a barometer of risk taking in the global market place. Many pundits are currently talking about how they are going to explode to the upside and that now is the time to buy in ahead of that move. But what do the technicals suggest? Let’s take a look.
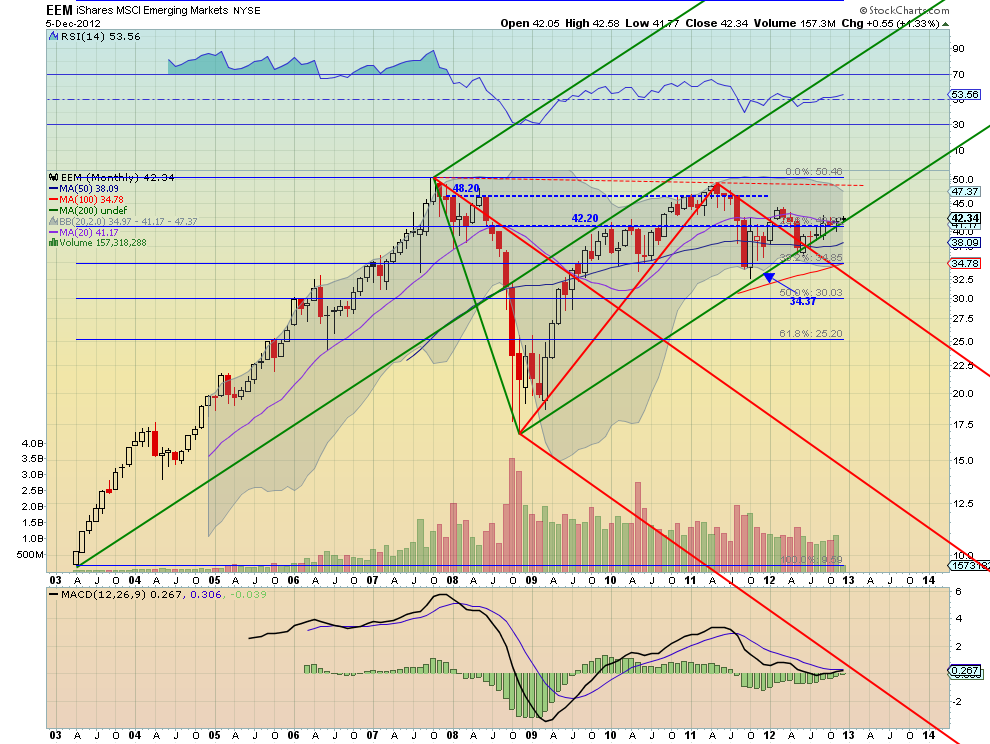
Starting with the monthly view above the slowing volatility is first noticed in the price action. A tightening range has persisted from the beginning of 2011, after a near retest of the the 2007 highs. This move started with in the bounds of the bullish (green) and bearish (red) Andrew’s Pitchforks, but after breaking above the Upper Median Line of the bearish Pitchfork in February of this year, the bullish Pitchfork has been in control.
The Relative Strength Index (RSI) has held in bullish territory since moving there off the 2008 bottom, but the Moving Average Convergence Divergence indicator (MACD) has been negative, diverging. Until this month. The MACD is on the verge or crossing into positive territory, joining the RSI in supporting a move higher. If this pushes the price higher, then the next important area is the Hagopian Trigger Line (dotted red line) at about 48.80 followed by the retest of the high. A move over that would trigger a target on a Measured Move to 63 and make all those pundits happy. 
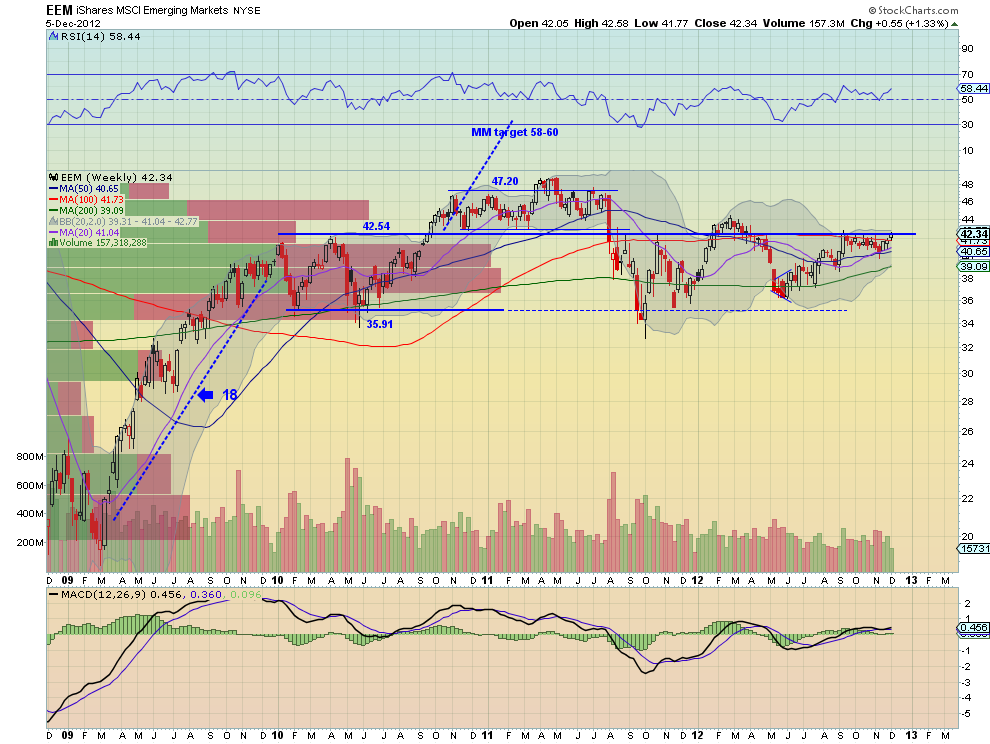
But it has some work to do on the shorter weekly time frame first. The chart above shows that the last 3 years of activity can also be viewed as a broad channel between 35.91 and 42.54 with a parallel channel above. The Volume by Price bars to the left show just how much volume has churned in this range compared to outside of it. All of the Simple Moving Averages (SMA) are running sideways with a RSI that is oscillating and flirting between bullish and bearish signals accompanied by a MACD that is flat.
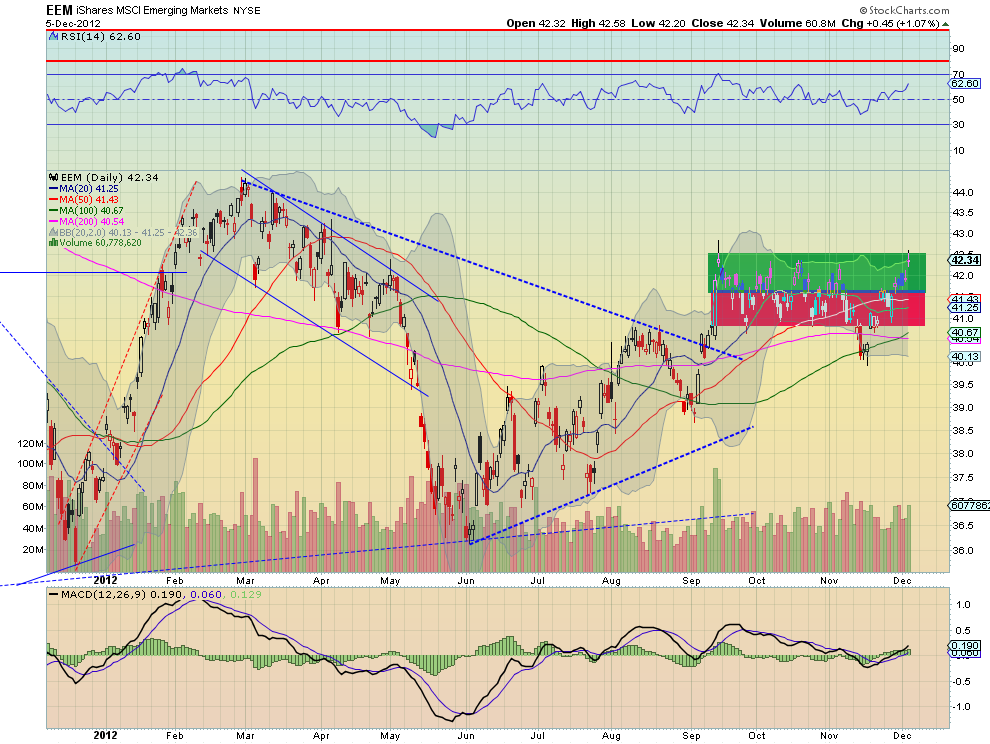
These give no signal as to a future move. At the top of the range the nod is given to the upside in terms of a potential breakout but only on a wait and see basis. It is the daily chart that controls the fate of this ETF. With the exception of a 4 day party to the downside out of the box, it has been in consolidation between 40.90 and 42.54 for over 3 months. 
Note that this is the top of the range in the weekly chart. Wednesday it was testing the top of the box for the first time since September with a RSI that is making new higher highs and a positive MACD. Both supporting a break to the upside. The break of the box higher continues the target from the symmetrical triangle break to 48.75 with a Measured Move to 44.75 along the way. There would be a lot of positive in this chart on a sustained hold over 42.54. But until then there is no power.
So there is an upward bias in all of the charts but being held back by a long term consolidation on all time frames. The key levels to watch are a break and hold above 42.54 causing a cascade higher possibly to 63, but failure continuing the morass until a a break down would occur under 40.90 that accelerates under 35.91.
Disclaimer: The information in this blog post represents my own opinions and does not contain a recommendation for any particular security or investment. I or my affiliates may hold positions or other interests in securities mentioned in the Blog, please see my Disclaimer page for my full disclaimer.
Original post
- English (UK)
- English (India)
- English (Canada)
- English (Australia)
- English (South Africa)
- English (Philippines)
- English (Nigeria)
- Deutsch
- Español (España)
- Español (México)
- Français
- Italiano
- Nederlands
- Português (Portugal)
- Polski
- Português (Brasil)
- Русский
- Türkçe
- العربية
- Ελληνικά
- Svenska
- Suomi
- עברית
- 日本語
- 한국어
- 简体中文
- 繁體中文
- Bahasa Indonesia
- Bahasa Melayu
- ไทย
- Tiếng Việt
- हिंदी
A Long-Term View On Emerging Markets
Published 12/09/2012, 01:08 AM
Updated 05/14/2017, 06:45 AM
A Long-Term View On Emerging Markets
Latest comments
Loading next article…
Install Our App
Risk Disclosure: Trading in financial instruments and/or cryptocurrencies involves high risks including the risk of losing some, or all, of your investment amount, and may not be suitable for all investors. Prices of cryptocurrencies are extremely volatile and may be affected by external factors such as financial, regulatory or political events. Trading on margin increases the financial risks.
Before deciding to trade in financial instrument or cryptocurrencies you should be fully informed of the risks and costs associated with trading the financial markets, carefully consider your investment objectives, level of experience, and risk appetite, and seek professional advice where needed.
Fusion Media would like to remind you that the data contained in this website is not necessarily real-time nor accurate. The data and prices on the website are not necessarily provided by any market or exchange, but may be provided by market makers, and so prices may not be accurate and may differ from the actual price at any given market, meaning prices are indicative and not appropriate for trading purposes. Fusion Media and any provider of the data contained in this website will not accept liability for any loss or damage as a result of your trading, or your reliance on the information contained within this website.
It is prohibited to use, store, reproduce, display, modify, transmit or distribute the data contained in this website without the explicit prior written permission of Fusion Media and/or the data provider. All intellectual property rights are reserved by the providers and/or the exchange providing the data contained in this website.
Fusion Media may be compensated by the advertisers that appear on the website, based on your interaction with the advertisements or advertisers.
© 2007-2024 - Fusion Media Limited. All Rights Reserved.
