On the heels of declaring a week ago that -- by no less than three technical measures -- Gold was poised to "pullback" over the near-term, I then corresponded with a couple of enthusiasts in writing: "I hope I'm wrong."
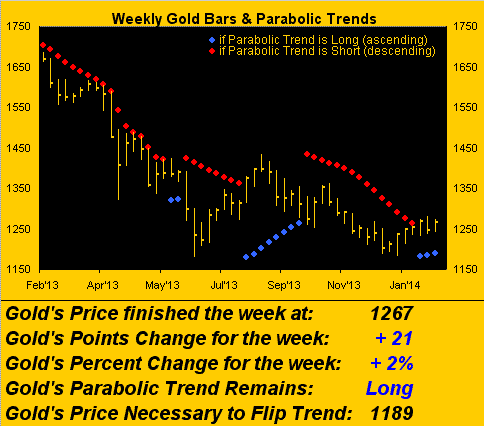
Now a week later, wrong is good. Gold just completed its sixth up week in seven, albeit given the broad increase in volatility at large for the BEGOS Markets (Bond/Euro/Gold/Oil/S&P), 'twas in a sense a quiet +2% run for the yellow metal, its tracing what is referred to as an "inside bar", (the rightmost one below having both a "higher-low" and "lower-high" vis-à-vis the prior week):
But the best takeaway for the week was Gold's successfully warding off a +3% run for the S&P 500 from Tuesday through yesterday (Friday). To be sure, the S&P at week's end remains by various textbook technical measures near-term oversold, which has been the case for the last 11 trading days. As Tuesday's pre-opening Prescient Commentary stated: "The Spoo (1739.25) looks poised to initiate a relief rally for the S&P which could be just enough to again set those two Gold studies negative." The Spoo (S&P futures) went on to settle the week at 1793.50. Yet at that writing, Gold was 1252.9; 'tis now 1266.8 despite this S&P recovery in a year which had continued to see these two markets remain negatively-correlated to one another, save for this past week.
One might thus opine: Gold "knows" that the S&P was due for a spate of temporary upside, "knows" that the S&P now some 50% of the way through Q4 Earnings Season is en route to its best year-over-year quarterly improvement since Q4 of 2010, but that the Index itself remains terribly expensive (our "live" p/e is 30.6x), and "knows" that the S&P -- as recently led in decline by the Economic Barometer -- might just persuade the FOMC with Old Yeller as Head Teller to temper their taper:
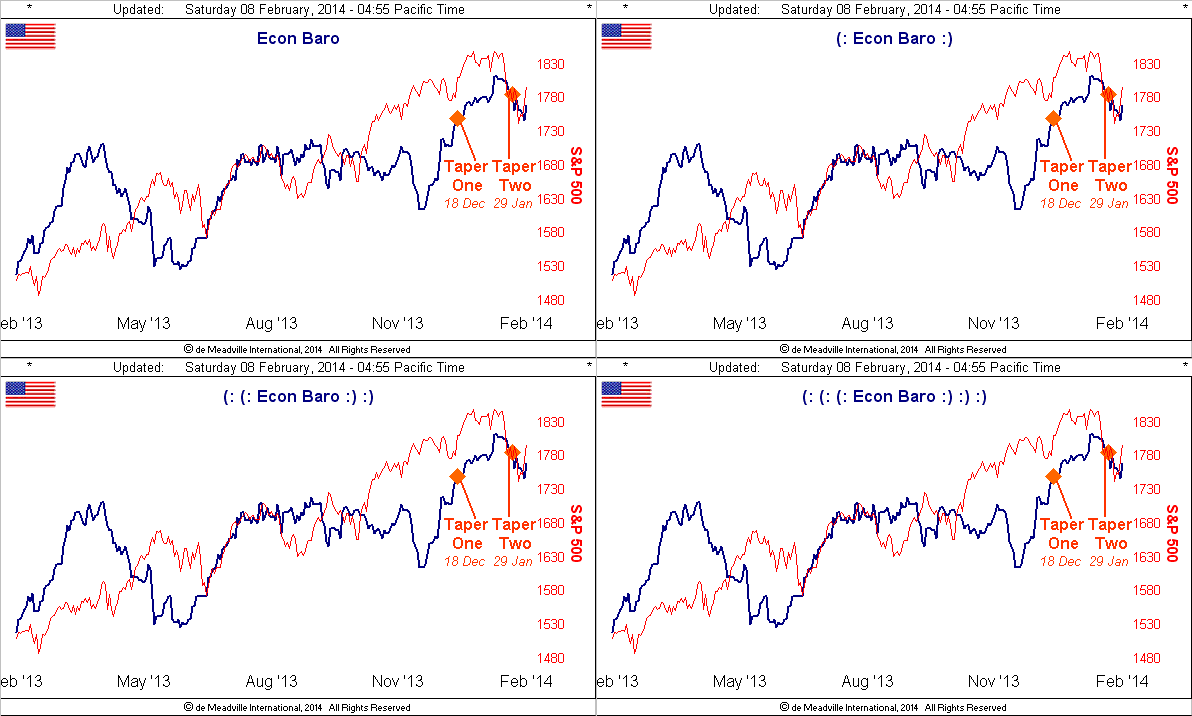
Notably antonyms for "taper" include: "enlarge, extend, grow, increase, rise", which have been the effects on the value of Gold, (the last two years aside), as money is pumped into systems worldwide.
Now as for those technical measures pointed out a week ago and as alluded to at the outset:
1) Gold never dipped enough to swing and confirm its daily MACD (moving average convergence divergence) into negative territory, although a settle come Monday below 1250.6 would so do, (and which given Gold's "expected daily trading range" of 19.5 points is well within a day's reach from here at 1266.8);
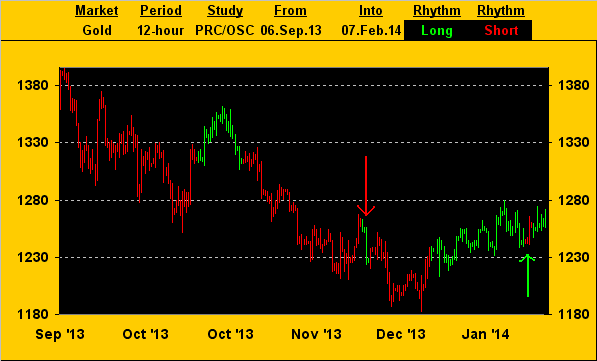
2) Gold's "price oscillator" study on the 12-hour bars did go negative as was arithmetically anticipated upon Sunday's open a week ago, but only briefly. For as we revisit the following chart from September-to-date wherein Gold's 12-hour price bars are red when the oscillator is negative and green when 'tis positive, you can clearly see the change in sentiment. Note especially the two arrows, how in bearish conditions the bars could barely remain green, but now in bullish conditions that red has become rare:
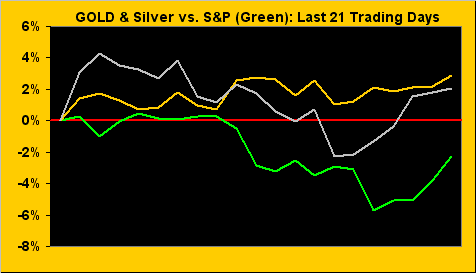
3) Gold's "Baby Blues" however are still falling, indicative of the current 21-day linear regression trend continuing to lose its consistency. But the trend itself remains up, certainly in contrast to "stuck-in-the-middle" Silver and the downcast S&P:
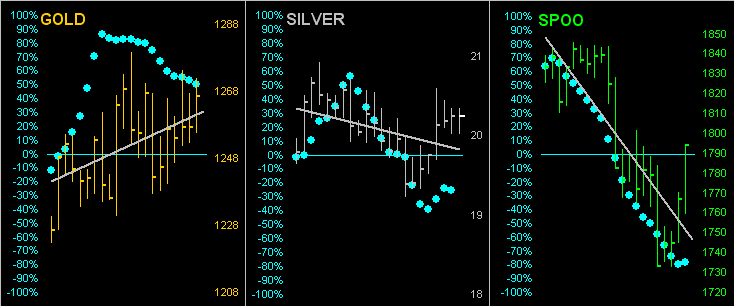
Our conclusion for these three technical traits of current interest (daily MACD, 12-hour price oscillator, Baby Blues) is that Gold's tide through its ebb and flow is truly turning northward. Remarkably -- and given its aforementioned negative correlation to the S&P which has really been in vogue for better than two years -- Gold stood stark to be slapped back down this past week, perhaps even severely so as had been its punishing fate through much of 2013. We'd even pointed to a Market Rhythm a week ago suggesting Gold's gains for the year could be lost. But no. Unrecognized by the FinMedia, whose wont is to only highlight Gold when 'tis in demise, a sea change is materializing, an incipient urgency amongst an astute few to ensure one owns some Gold, or at least an identification of an improving trend from the perspective of traders.
The technical road to success for traders, (whose modi operandi vary to those of more fundamentally-based investors), is to the horizon paved with stones which read "the trend is your friend". If one followed the traders' route for Gold during last year, one was handsomely rewarded with shortside profit. (However, regular readers know I've an aversion to shorting Gold, given its proven ability to gap up 40 points between one session's close and the ensuing one's open with nary a chance to escape in between; I oft think shorting Gold ought carry warnings similar to those which use almost the entirety of one-minute adverts for the latest synthetic wonder drugs, their myriad of side effects running from acne, dyspepsia, dysphagia and fatality to bad gas).
Still, prudent response to the technicals on Gold or other major liquid markets generally pays off if one targets a measured and sensible reward, (which is why we developed the Market Rhythms stuff in an effort to attempt making consistently worthy trades without greed). Exceptionally and especially so for Gold, the fundamentals on occasion do direct one's technical dissections into the dust bin, such failed analyses from the perspective of broader-based investors being just fine, (i.e. their only being buyers and holders of Gold in an environment of global monetary accommodation). Albeit problematic en route as we saw in 2013 is the investor's timing, (were one not to have escaped, only to now have to grapple with getting back on board). However, in exemplifying their eventual success, a long-time reader of ours proudly marches his monthly social security check into the Gold dealer's shoppe and exits with the metal. And he's regularly smiling without even having to go to the bank :)
Let's next turn for a moment to Sister Silver who cannot sort her precious metal pinstripes from her industrial metal jacket. Decisions, Decisions! To ride alongside her gallant Gold, or fall away as the S&P doth fold? "Torn Between Two Lovers"--(Mary MacGregor, '76) is one thing but being the Silver Sandwich is not what proponents of the white metal have necessarily been anticipating...
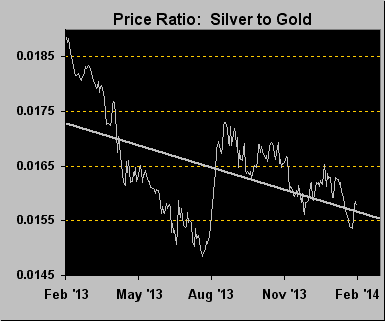
...and yet there is a pro-Silver Lining: with respect to the S&P having put on such a straight up show a year ago during which time Silver did not benefit as an industrial metal, but rather declined as a precious metal along with Gold, the case can currently be made that Silver's price relative to Gold's is indeed too low. Here we've the ratio of the daily prices of Silver to Gold over the last year-to-date:
Further, Silver confirmed a positive crossing of the MACD study on its daily bars per the opening of yesterday's session, which by our Market Rhythms suggests a near-term run from the confirmation price of 19.930, (or currently 19.980) of +0.840 points (or $4,200/contract) to 20.770. Wayfaring worth watching.
More broadly as we return to Gold, in the left-hand panel of the three-month graphic below, we see its smooth pearly valuation line, (a measure of Gold's movements relative to those of the BEGOS markets), now turning up, and by the oscillator at the chart's foot, price not being overly high above value...
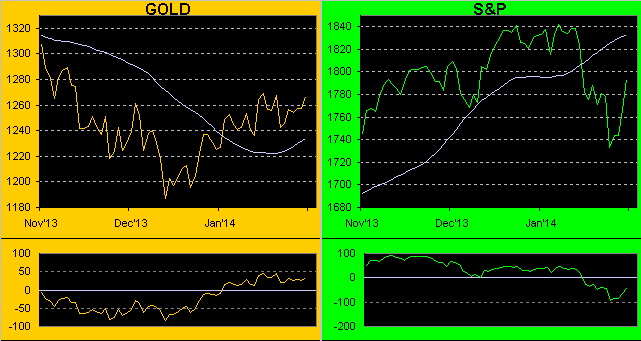
...whereas in the right-hand panel for the S&P, as robust as price has suddenly become, so too ought it meet straight away with resistance having now returned up into this 1780-1800 zone, as we anticipate the relief rally to run out of puff.
"But mmb, all your giddy bullishness for gold looks small in the big picture..."
And that, Squire, is what by which we close out this week's missive. The chart below of Gold's Structure (weekly bars) is a sober reminder of how particularly puny the recent bull run has been and that there remains still a long way to go...
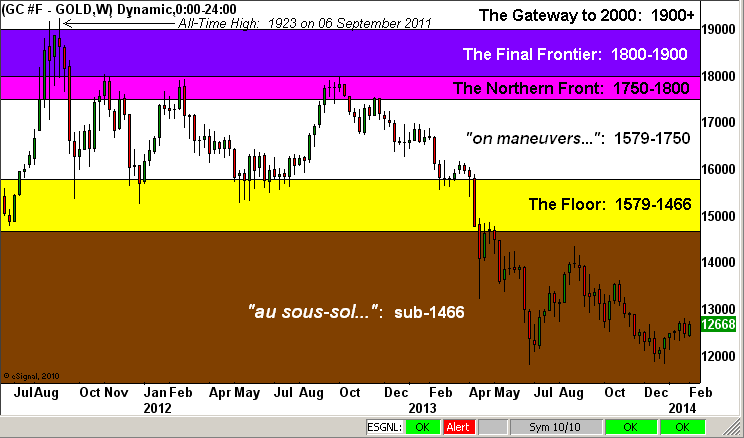
...the bright side therein obviously being the ample opportunity to profit on the upside. As the Gold price ultimately is fueled by debasing dinero, in tandem with the technicals 'tis frugal to follow the fundamentals. To wit, these quick three notes as we wrap it up:
1) "Tapering" by the Fed is not a withdrawal of resources; they're still pouring in as was herein parsed a week ago at the rate of $3 billion per work day -- (monetarily accommodative);
2) Reuters writer Edward Hadas rightly pointed out this past week that the EuroZone's biggest challenge is its debt, not deflation -- (monetarily accommodative);
3) China by yet another weak manufacturing survey is hardly soothing concerns and unnerved bourses for developing/emerging market economies (monetarily accommodative).