Companies reporting this week include NVIDIA, Walmart, JD.com, Alibaba, Home Depot and Peloton. So let’s get to it straight away.
{{0|
1. S&P 500
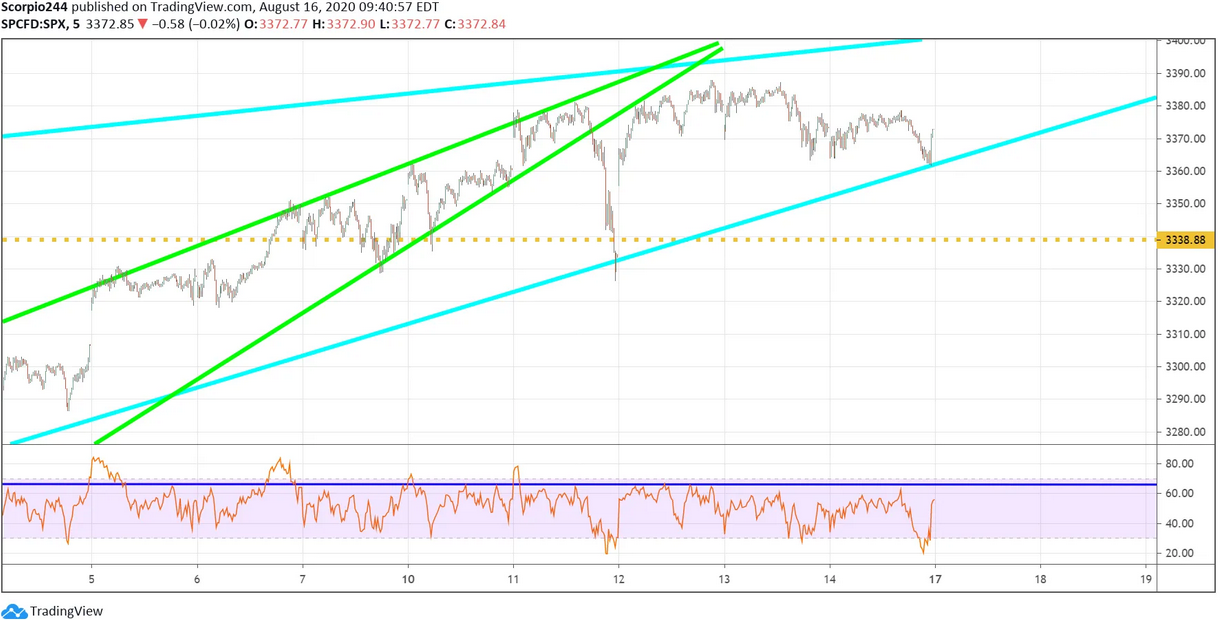
There is still that giant gap left to be filled on the S&P 500 this week, around the 3,340, and it seems likely that it finally does get filled on Monday.
2. Baltic Freight
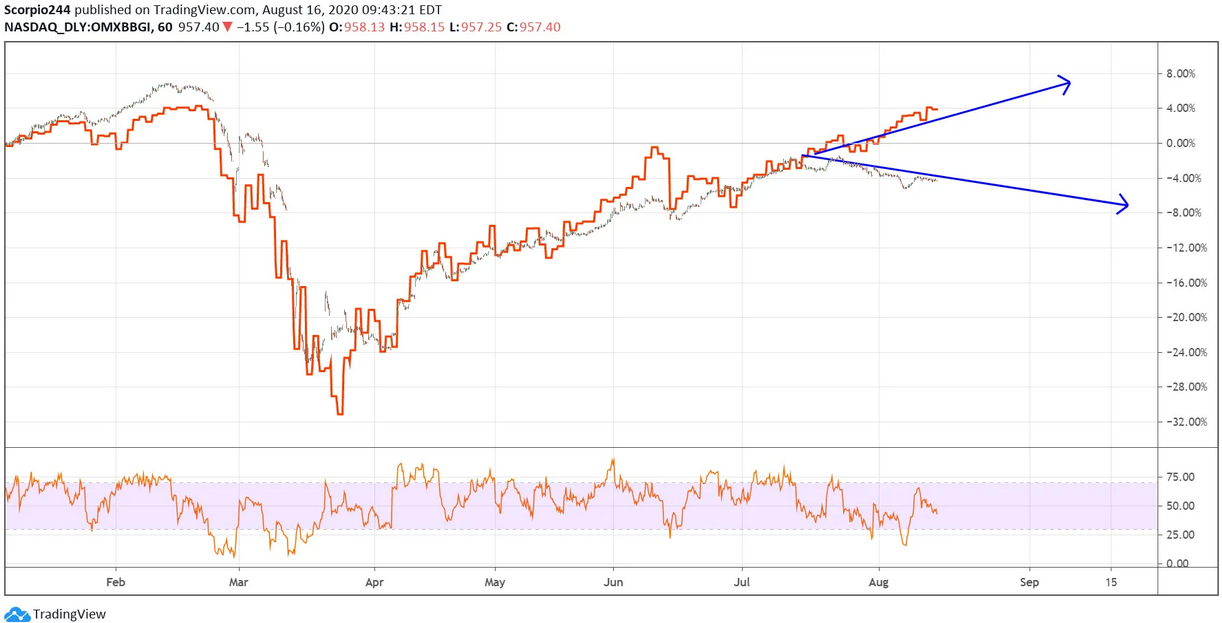
We are starting to see some divergence in some key economically sensitive indexes, like the Baltic Freights.
3. NVIDIA
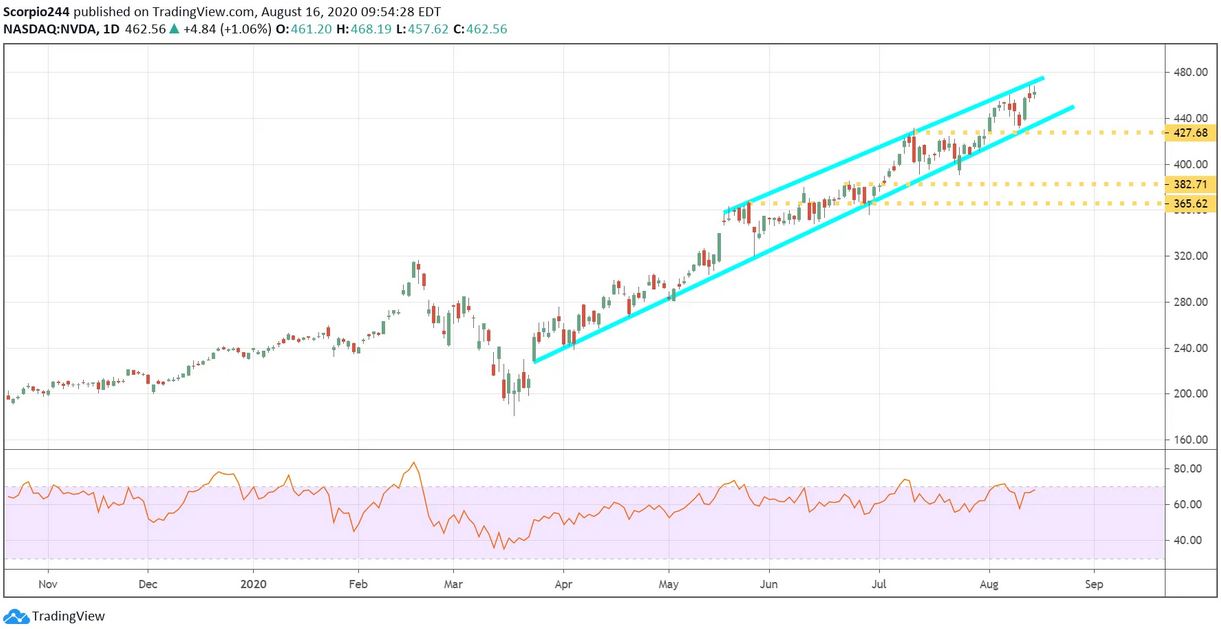
NVIDIA (NASDAQ:NVDA) will report results on Wednesday afternoon. The stock has been rising nearly entirely channel since April, which is incredible. I had seen a lot of bearish betting in this stock in July, that were for expiration on August 21. At the time, it seemed reasonable for the stock to fall to around $380. At this point, this doesn’t look like it is meant to be, but I guess only time will tell whether my view turns out to be right.
4. Alibaba
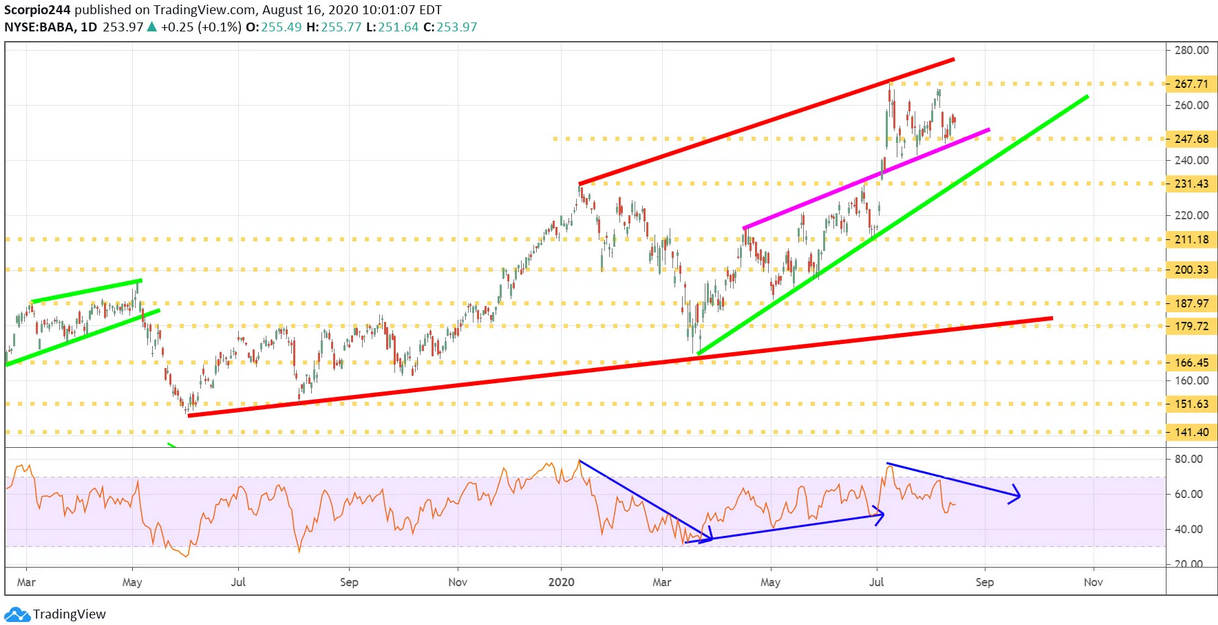
Alibaba's (NYSE:BABA) chart is a mess, and the stock has seen some selling of calls at the $295 strike price for expiration on August 21. It suggests the stock falls following the results, based on that declining RSI, perhaps back to $230.
5. JD
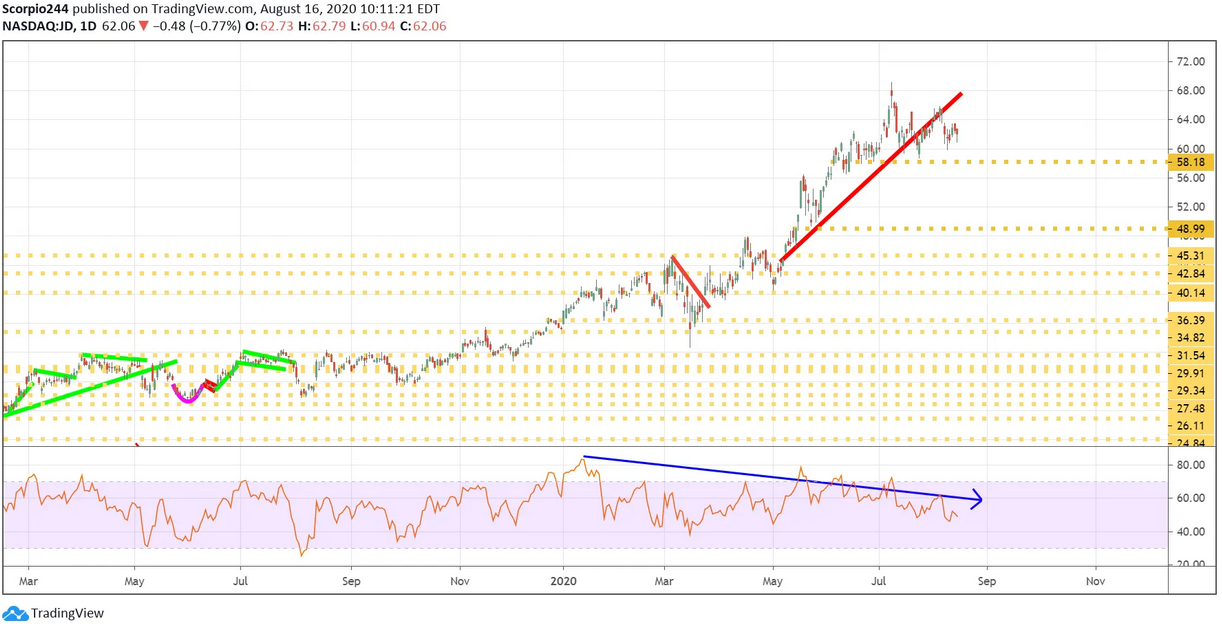
JD.com (NASDAQ:JD) has also seen some bearish betting in recent weeks. The August 21 calls at the $62 strike price have seen their open interest rise by 9,161 contracts, which were sold. Additionally, there has been some putting buy of the September $55 strike price, which implies the stock falls to around $54 by the middle of September. The chart suggests the stock falls to approximately $49, after breaking an uptrend over the next few weeks.
6. Walmart
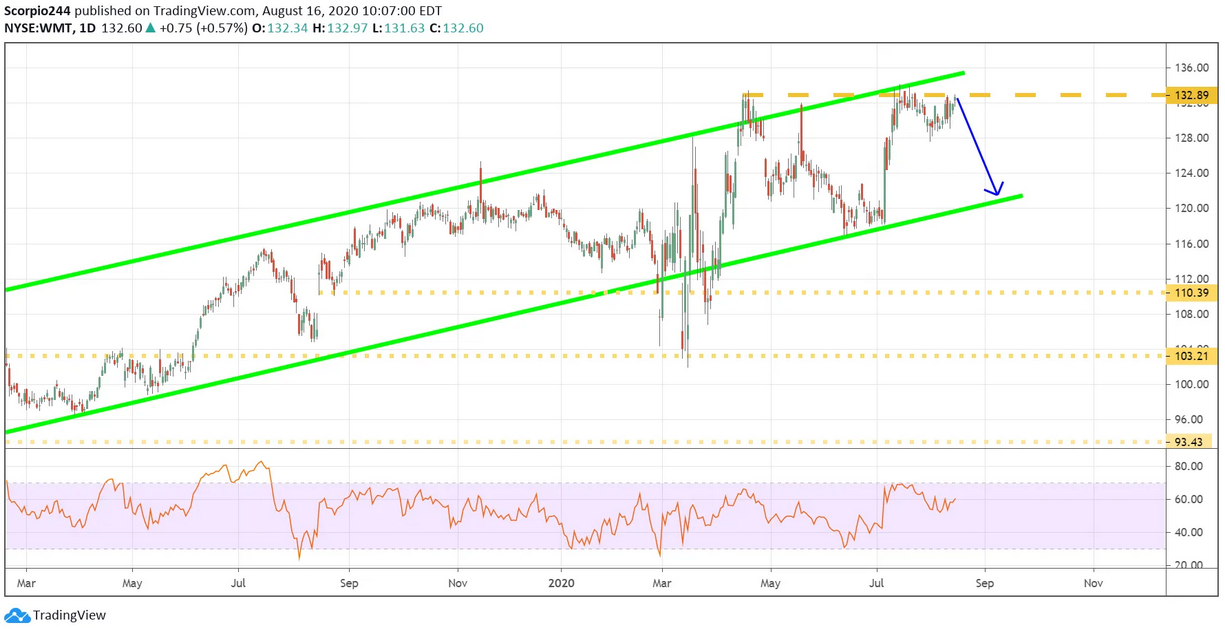
Walmart (NYSE:WMT) has also seen some bearish betting in recent days. The August 21 puts at the $135 strike price have risen by almost 10k contracts over the past five days, and indicate the stock falls to around $129. The chart shows a stiff resistance level around $133 and that the shares fall to about $121.
7. Home Depot
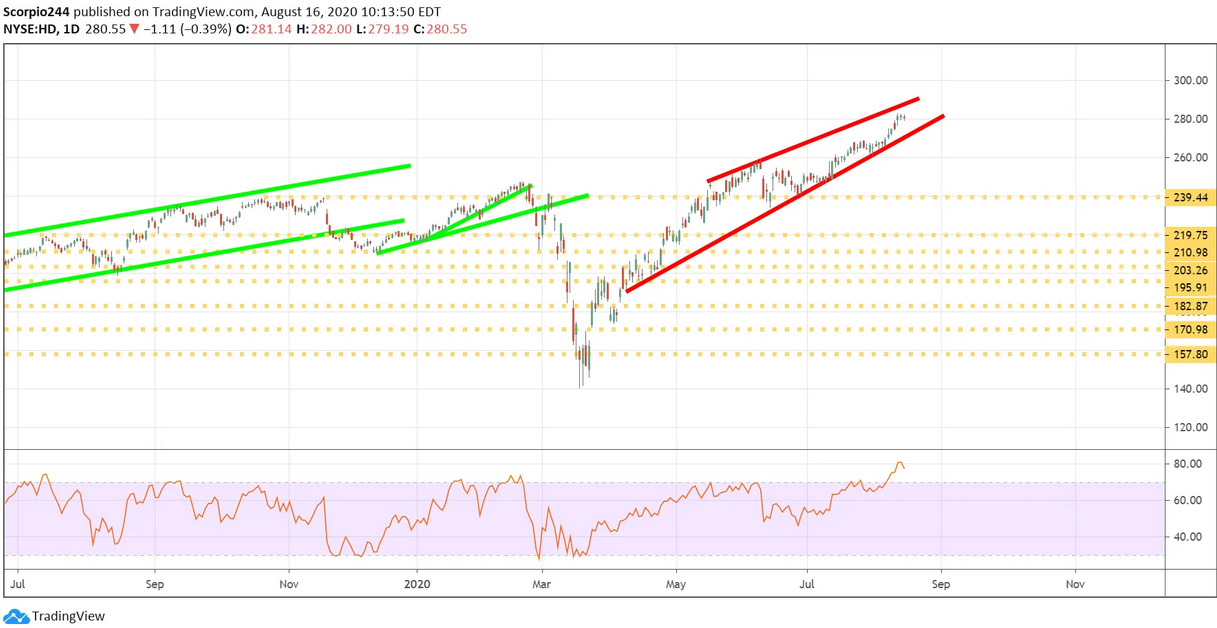
Meanwhile, Home Depot (NYSE:HD) has formed a rising wedge, but the chart suggests the stock first rises to around $290 before turning lower.
8. Peloton
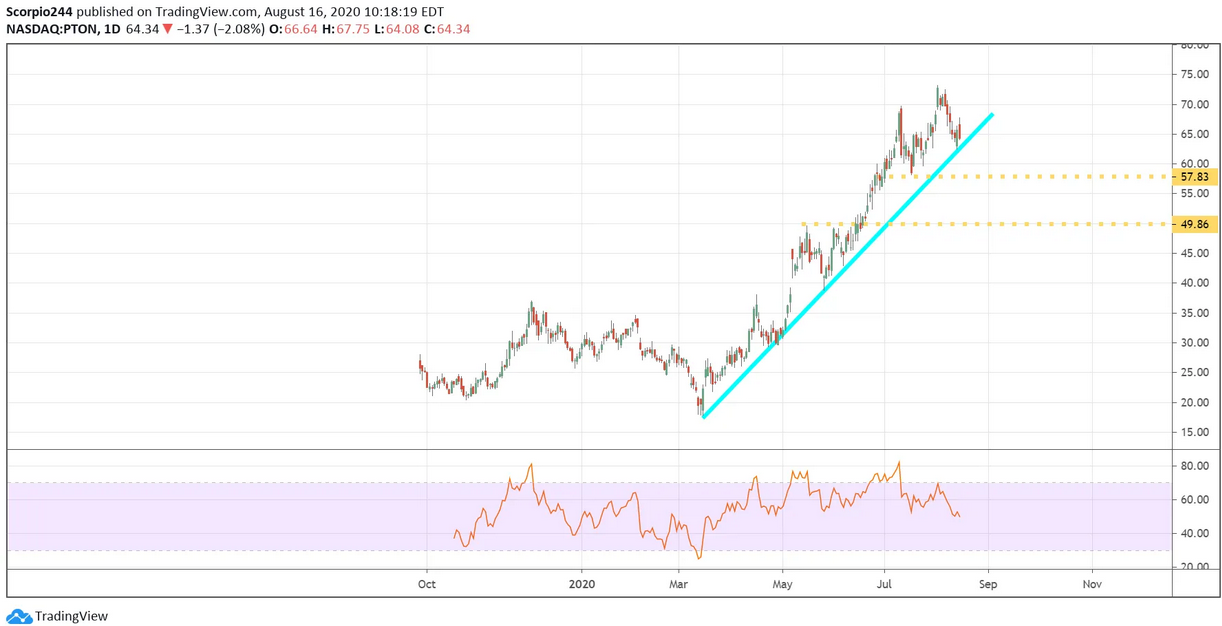
Peloton (NASDAQ:PTON) is resting on an uptrend, and a break of that uptrend sends the stock lower to around $57.
9. TJX
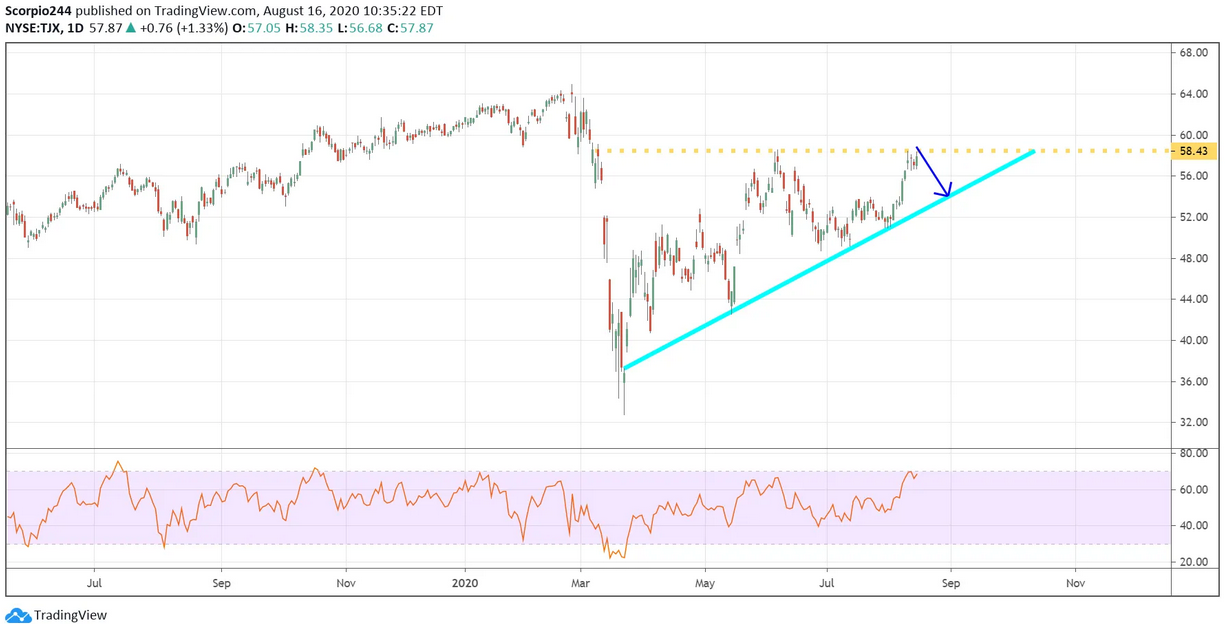
TJX (NYSE:TJX) will also report results this week, and there has been a bunch of put buying here too, for the September $55 strike price, which implies a break-even price of $53. Additionally, there were some selling of the September $62 calls. The chart shows that the stock has stalled out at resistance at $59, with the potential to fall back to the uptrend at $54.
