MACRO
It will be a relatively uneventful week from an economic and central bank standpoint. The only significant headlines will center around some flash PMI readings. However, one significant point of interest will likely come on September 26 when Micron (NASDAQ:MU) reports its fiscal fourth-quarter results.
Micron (MU)
Analysts are looking for the company to say that earnings for the fourth quarter fell by 86% to just $0.48; meanwhile, revenue is expected to have declined by 46% to $4.55 billion.
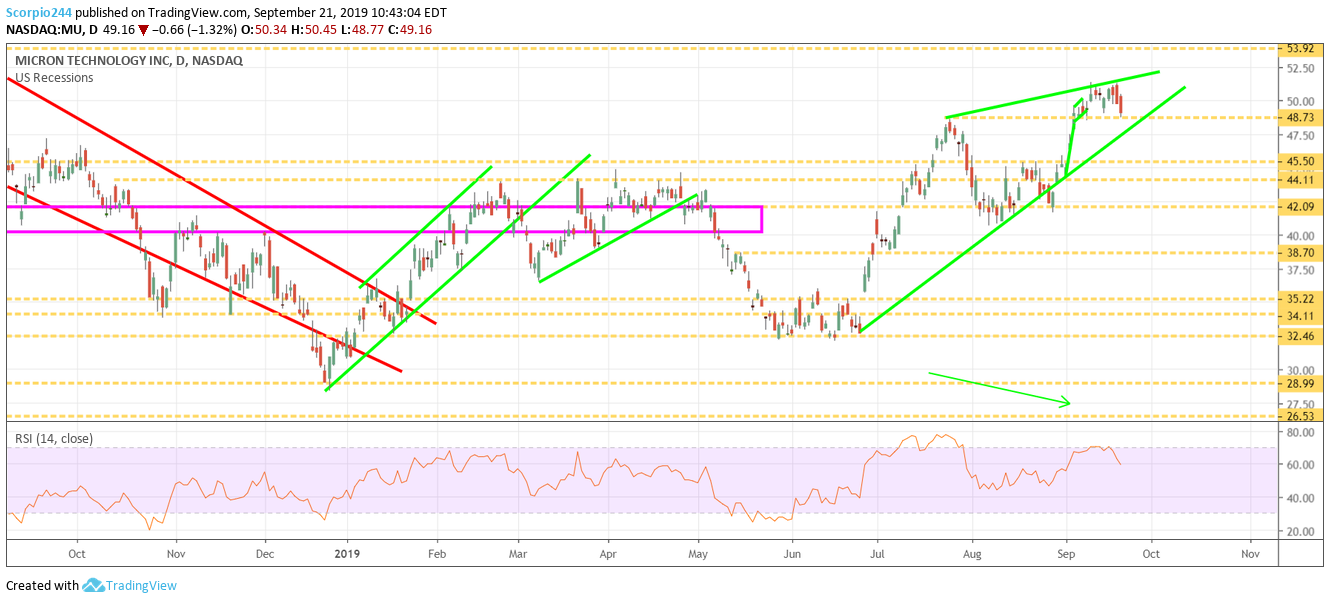
I had been looking for the stock to rise to around $54 in recent weeks. To this point, I think that may still be possible. The shares have found a meaningful level of technical support at $48.75 this past week. The trend has been mostly higher, but there does appear to a rising wedge forming in the chart, and that may be an indication that a reversal may be coming following the results. We will have to monitor during the week. The region around $54 may be the top for the short-to-medium term.
Roku (ROKU)
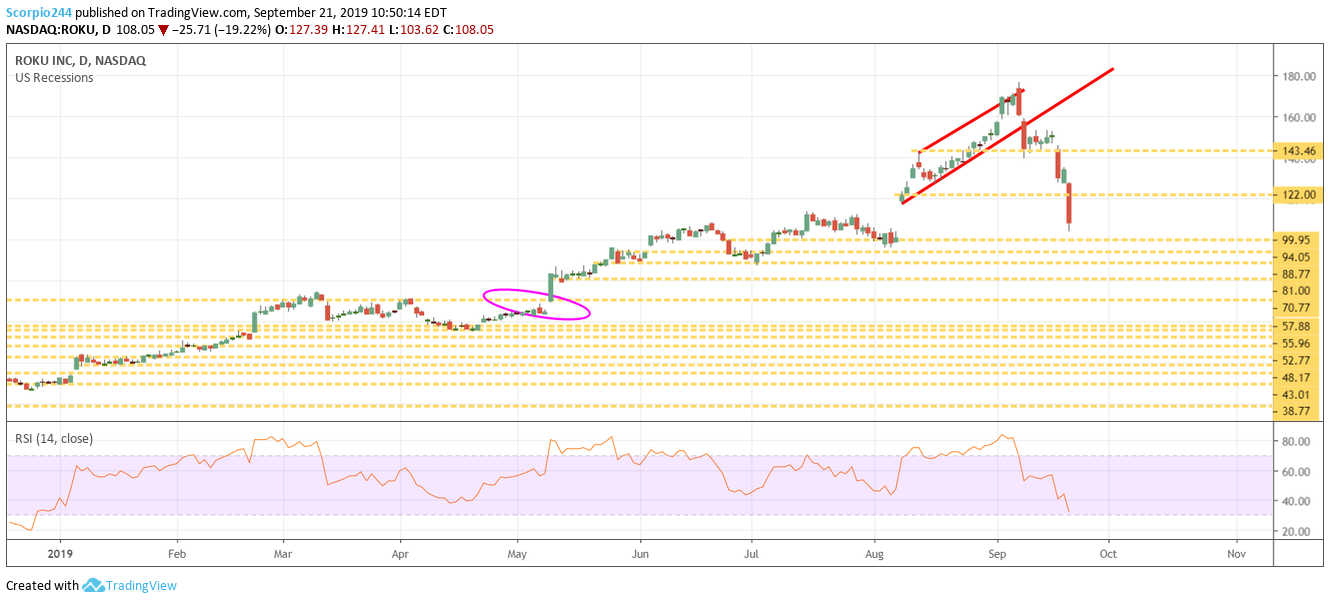
Roku is another stock I know everyone is asking about. I have been saying for months this is a speculative stock. The momentum has broken, and you can see what has happened. The valuation is entirely out of whack and without any reality. The stock has filled the gap at $100. I do think that gap at $60 is scary, and should not forget about. The real test comes early this week because I believe it will rebound to back to $122. If the stock fails to advance past that $122 region than I think $60 become a genuine possibility.
Netflix (NFLX)
Netflix (NFLX) continues to have problems and has not worked out the way I thought it would, to my disappointment. I’m feeling uncertain about what happens next. The perception of increasing competition has taken hold. It will take a solid quarter along with strong guidance from the company for the fourth quarter to break that perception.
Evercore ISI noted that international App downloads have only grown by 5% in September y-o-y vs. growth of 21% in July and August. Let’s keep in mind the company added about 6.1 million paid subs in the third quarter last year, with 5 million coming from International. Meanwhile, Netflix (NASDAQ:NFLX) is forecasting total paid subscriber growth of 7 million in the third quarter this year. Plus this report only notes app downloads on Google (NASDAQ:GOOGL) and Apple (NASDAQ:AAPL). Hard to say how many new sign-ups come from Roku and other streaming devices.
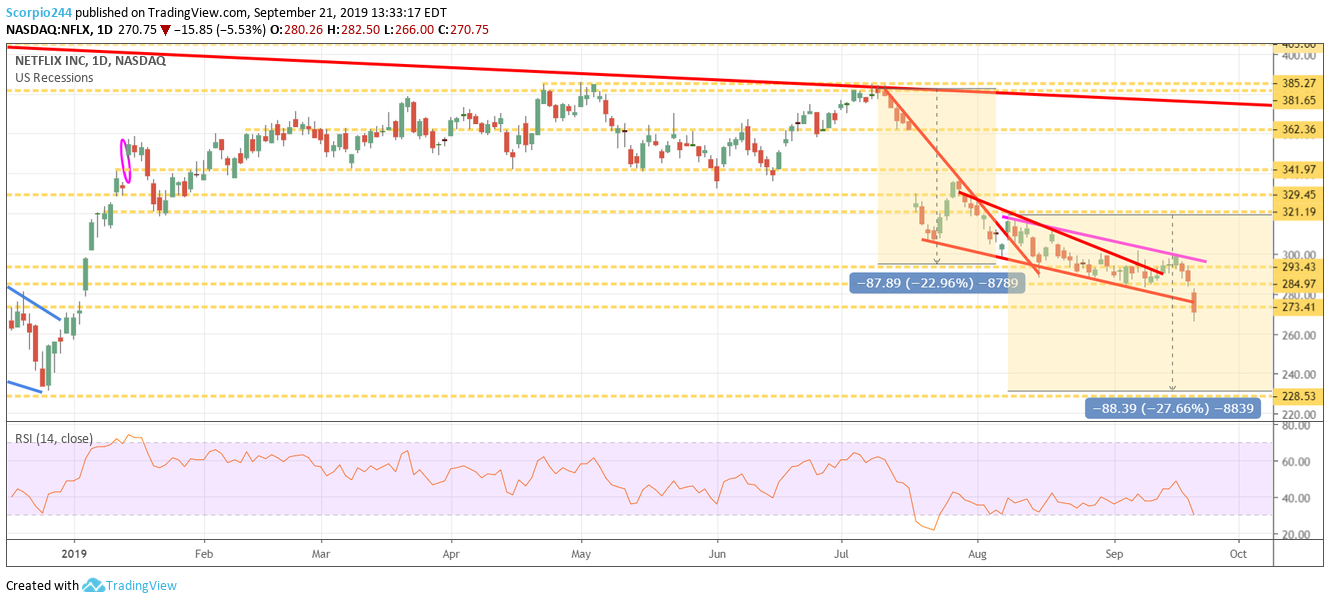
I’m not sure where the stock goes from here, to be honest. I’m confused by the chart, and the falling wedge to this point has proven to be completely wrong. The only pattern that I can now trace out appears to be a bear flag or pennant. But this pattern has only come after the fact.
At this point, one must think that there is a chance for a retest of the December lows. The stock will need to retake $284 to avoid this scenario.
Acadia (ACAD)
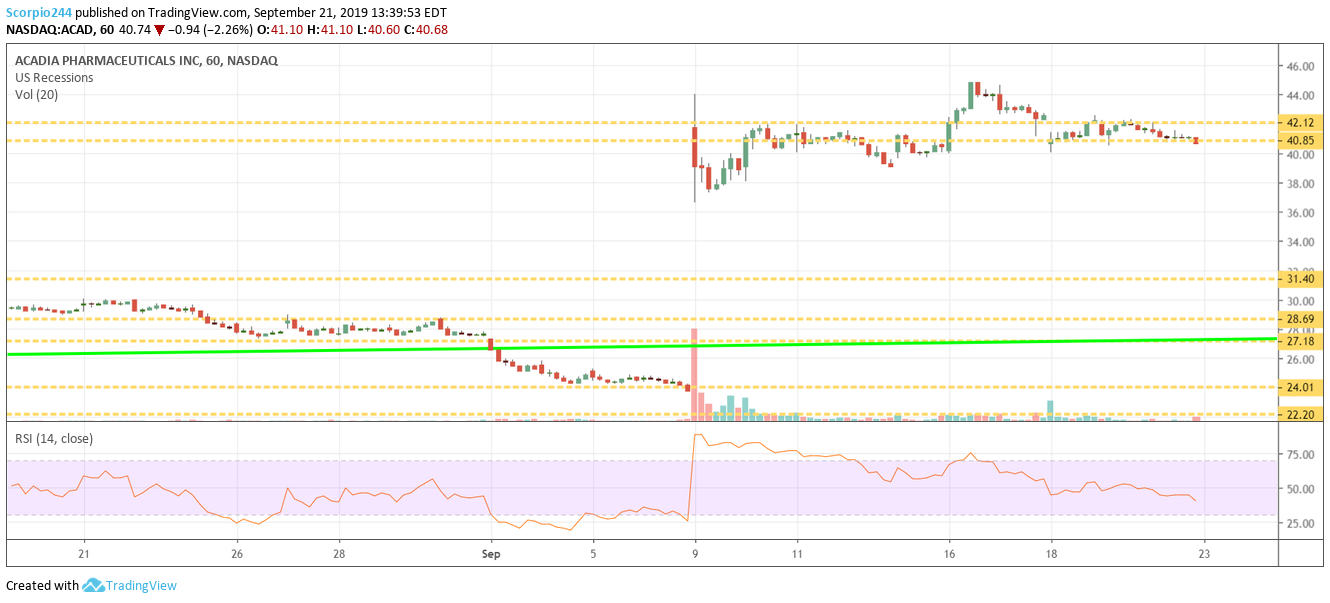
Well, the Bakers now own about 41 million shares of Acadia (NYSE:AKR) or 27% of the company. The company is due to release some data at two upcoming conference, one this weekend. The stock has traded reasonably well following the secondary. It has struggled around resistance at $42. That price remains the high hurdle mark for now.
Cisco (CSCO)
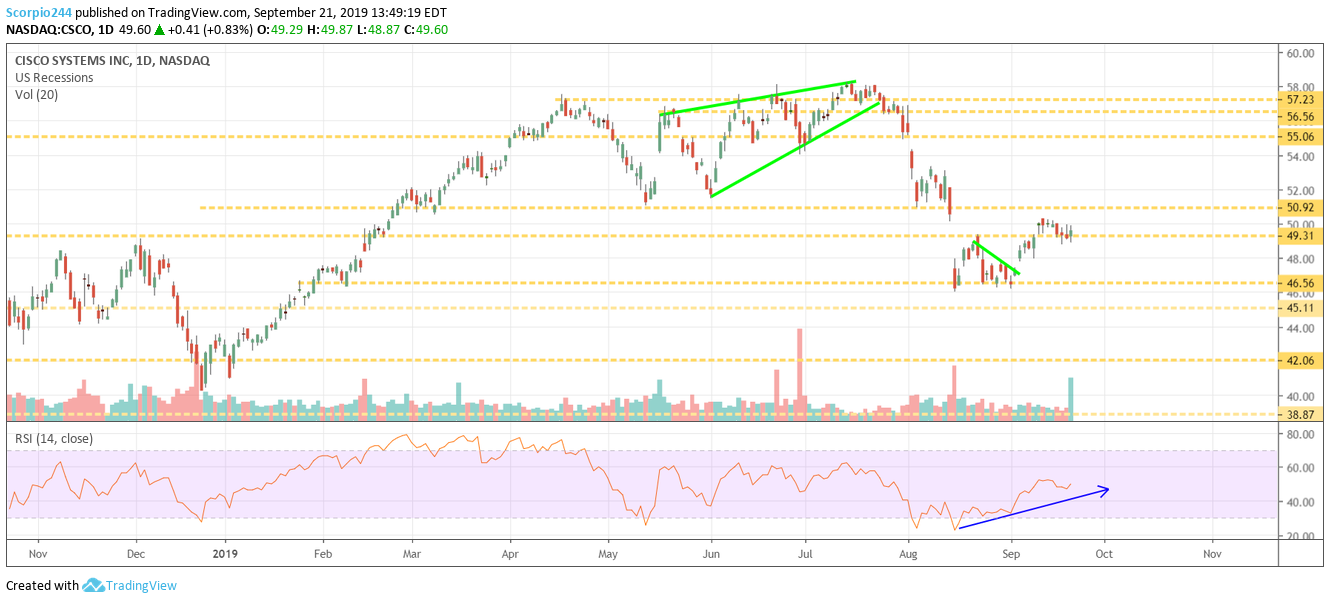
Cisco (NASDAQ:CSCO) has acted well recently, holding on to support around $49 for some time. We can see that the RSI has been trending higher off of oversold levels, and I think that will help to push the shares higher and back over $51.
Blackberry (BB)
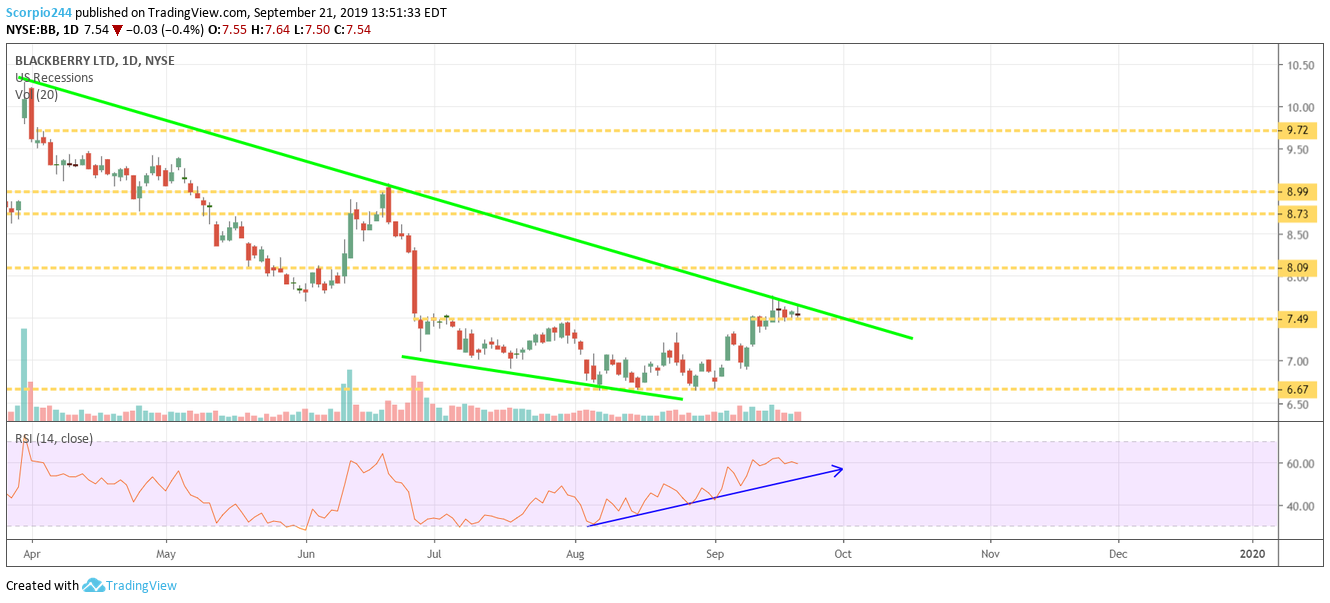
Blackberry (TSX:BB) has been consolidating nicely around the downtrend and is getting smushed between that downtrend and support at $7.50. It will have to break out this week or will face a pretty steep reversal lower.
Disney (DIS)
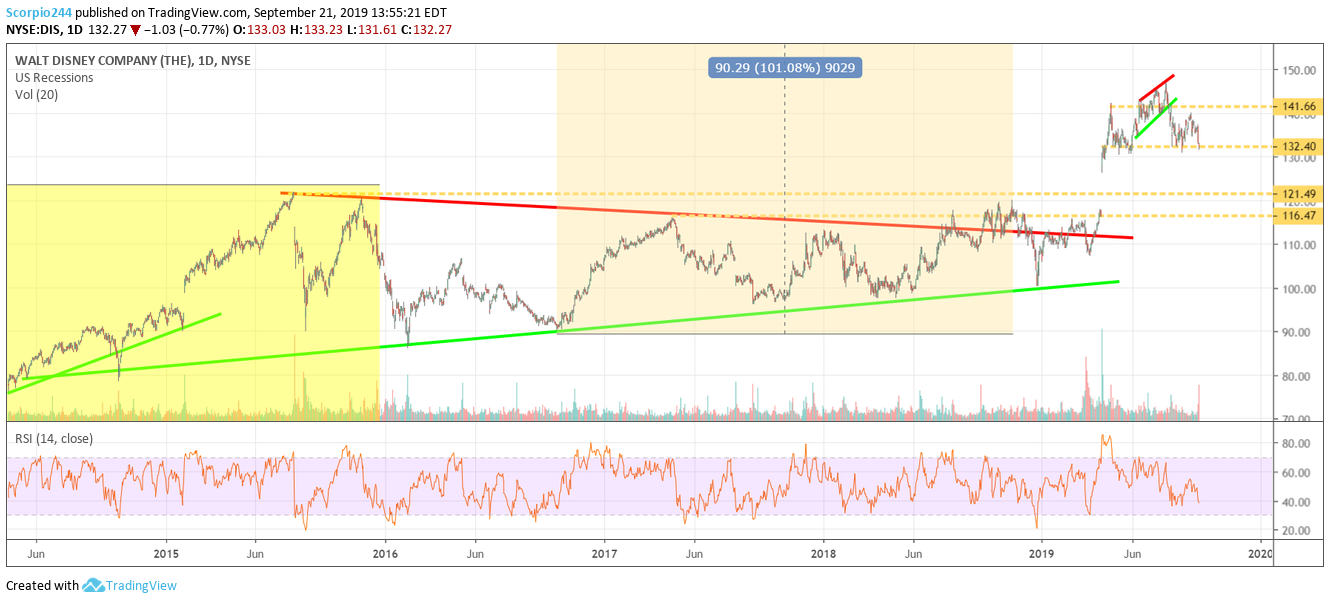
Disney (NYSE:DIS) is fighting for its life at $132. The chart is starting to look like a head and shoulders, which means it could be finding itself moving lower towards that gap at $121.50. A pullback won’t be the worst thing in the world; the stock still has much further to climb.
Facebook (FB)
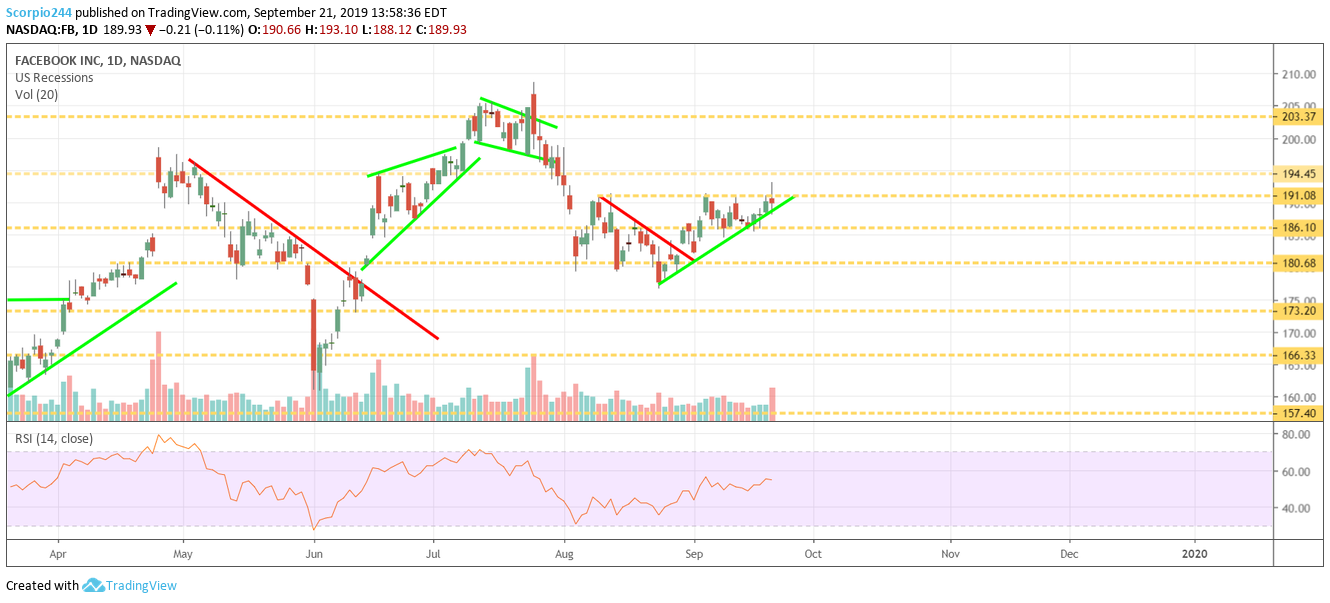
I thought Facebook (NASDAQ:FB) was breaking out, and that some bullish options bets would lift the stock. We will see.
The SA Market Place section has grown, up to 100 members now. All they do is chat all day with each other about trading and stocks. It is fun to watch.
