Get 40% Off
💰 Buffett reveals a $6.7B stake in Chubb. Copy the full portfolio for FREE with InvestingPro’s Stock Ideas toolCopy Portfolios

7 Monster Stock Market Predictions For The Week of April 20

Published 04/20/2020, 12:05 AM
Updated 09/20/2023, 06:34 AM
AAPL
-
AMZN
-
AMD
-
NFLX
-
JD
-
SHOP
-

Earnings season will kick into high gear this week, and it could be the determining factor into which way stocks will move from this point forward.

S&P 500 (SPY)

Momentum for stocks has been undoubtedly bullish these past weeks, and it has resulted in a nearly 14% increase since April 3. The relative strength index has been steadily rising as well, supporting the bullish move higher. However, the next significant level of resistance comes around 2,920, which would also market a 61.8% retracement off the lows. It could prove to be a significant turning point should the index fail to rise above that resistance level, with support around 2735.
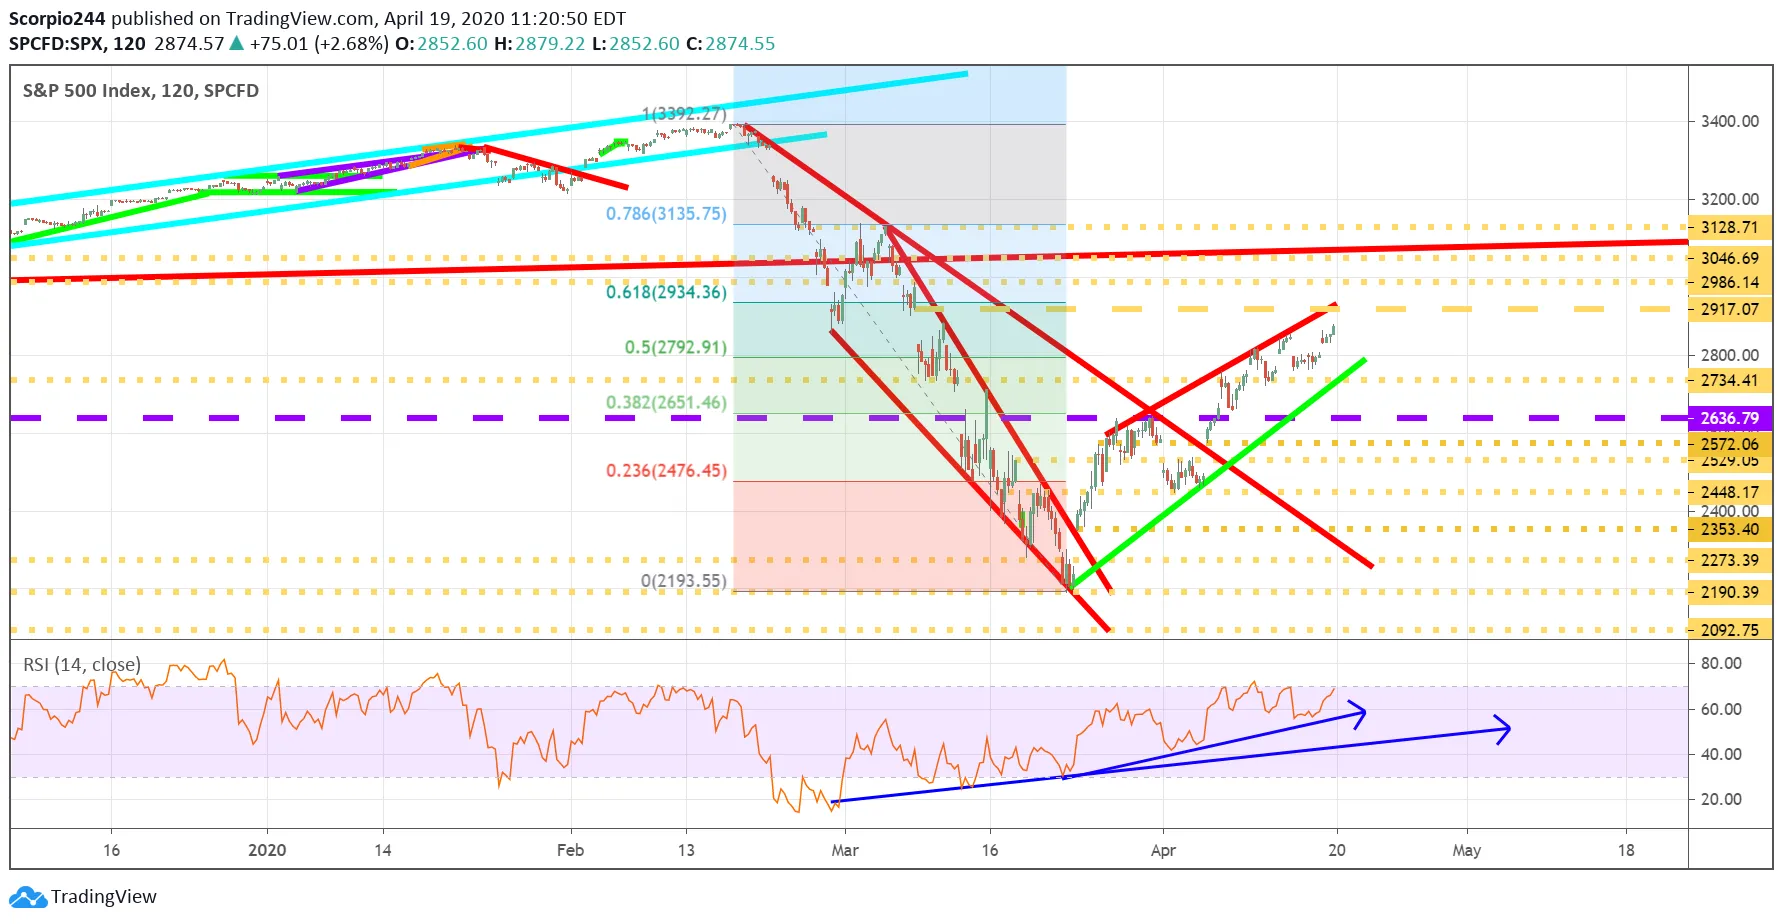
S&P 500 Index Chart

Netflix (NFLX)

Netflix (NASDAQ:NFLX) has hit overbought levels with a reading of 70, and the trend now appears to be shifting. The RSI failed to make a new high despite the stock making a new high, a bearish divergence. It would suggest that the stock has topped out and could retrace to around $375.
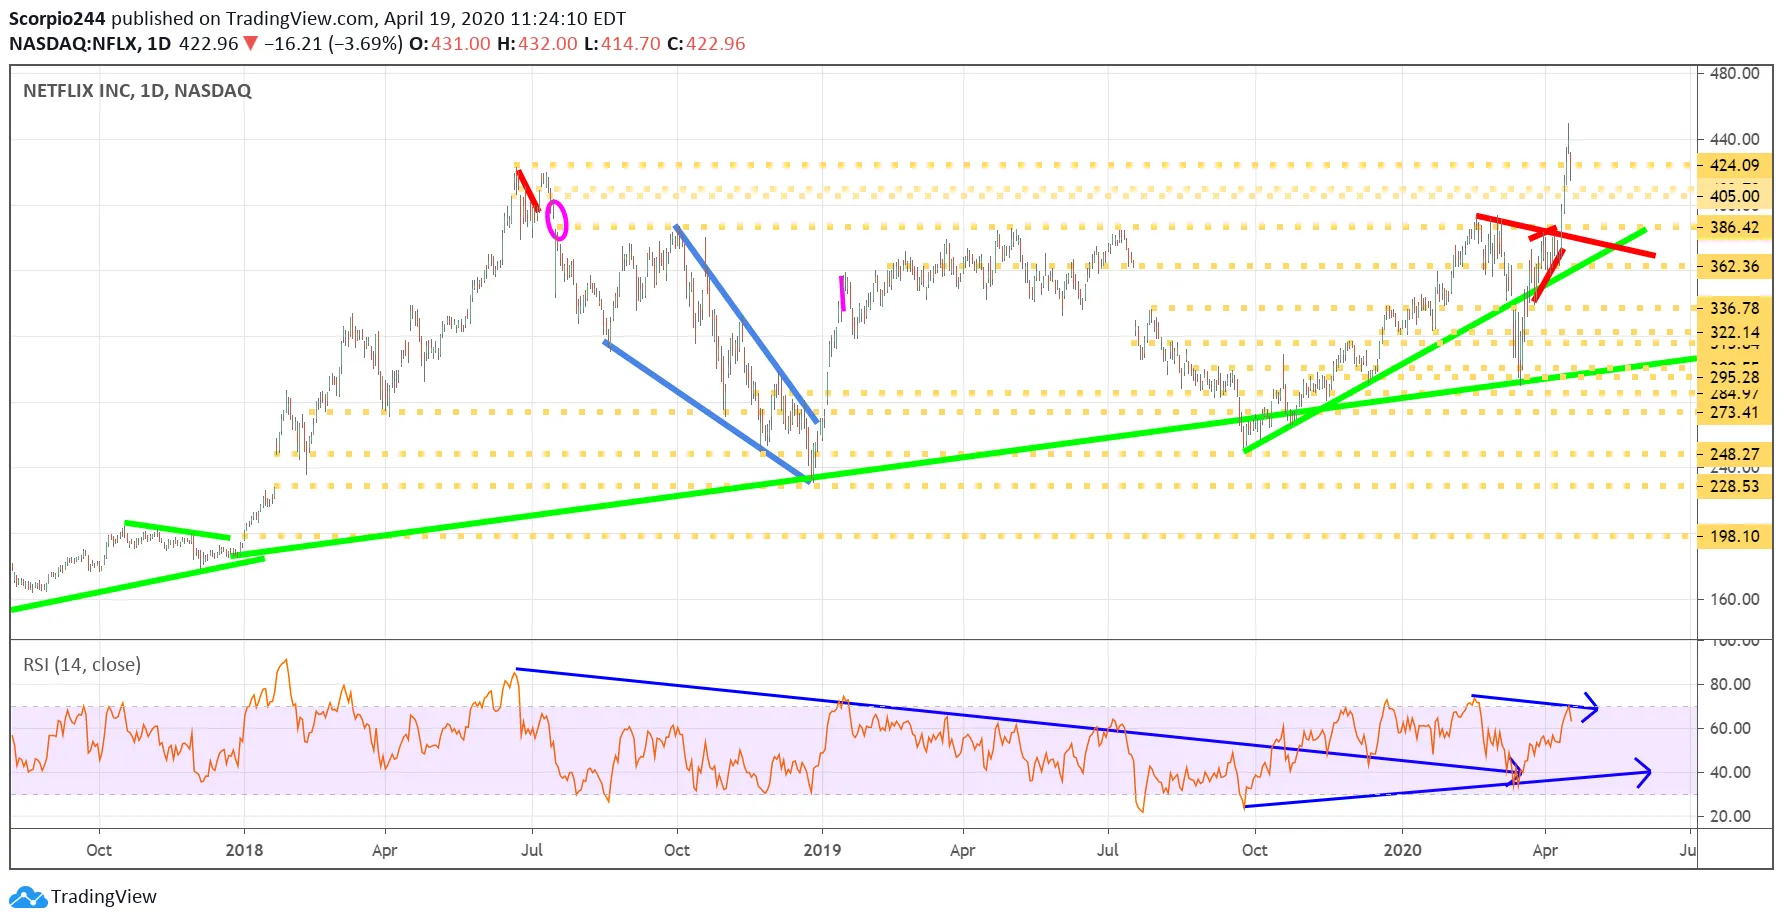
Netflix Daily Chart

Amazon (AMZN)

Amazon (NASDAQ:AMZN) will not report results until April 30, but it too has formed a bearish divergence, with the RSI also failing to make a new high. The stock could pullback this week towards $2,135.
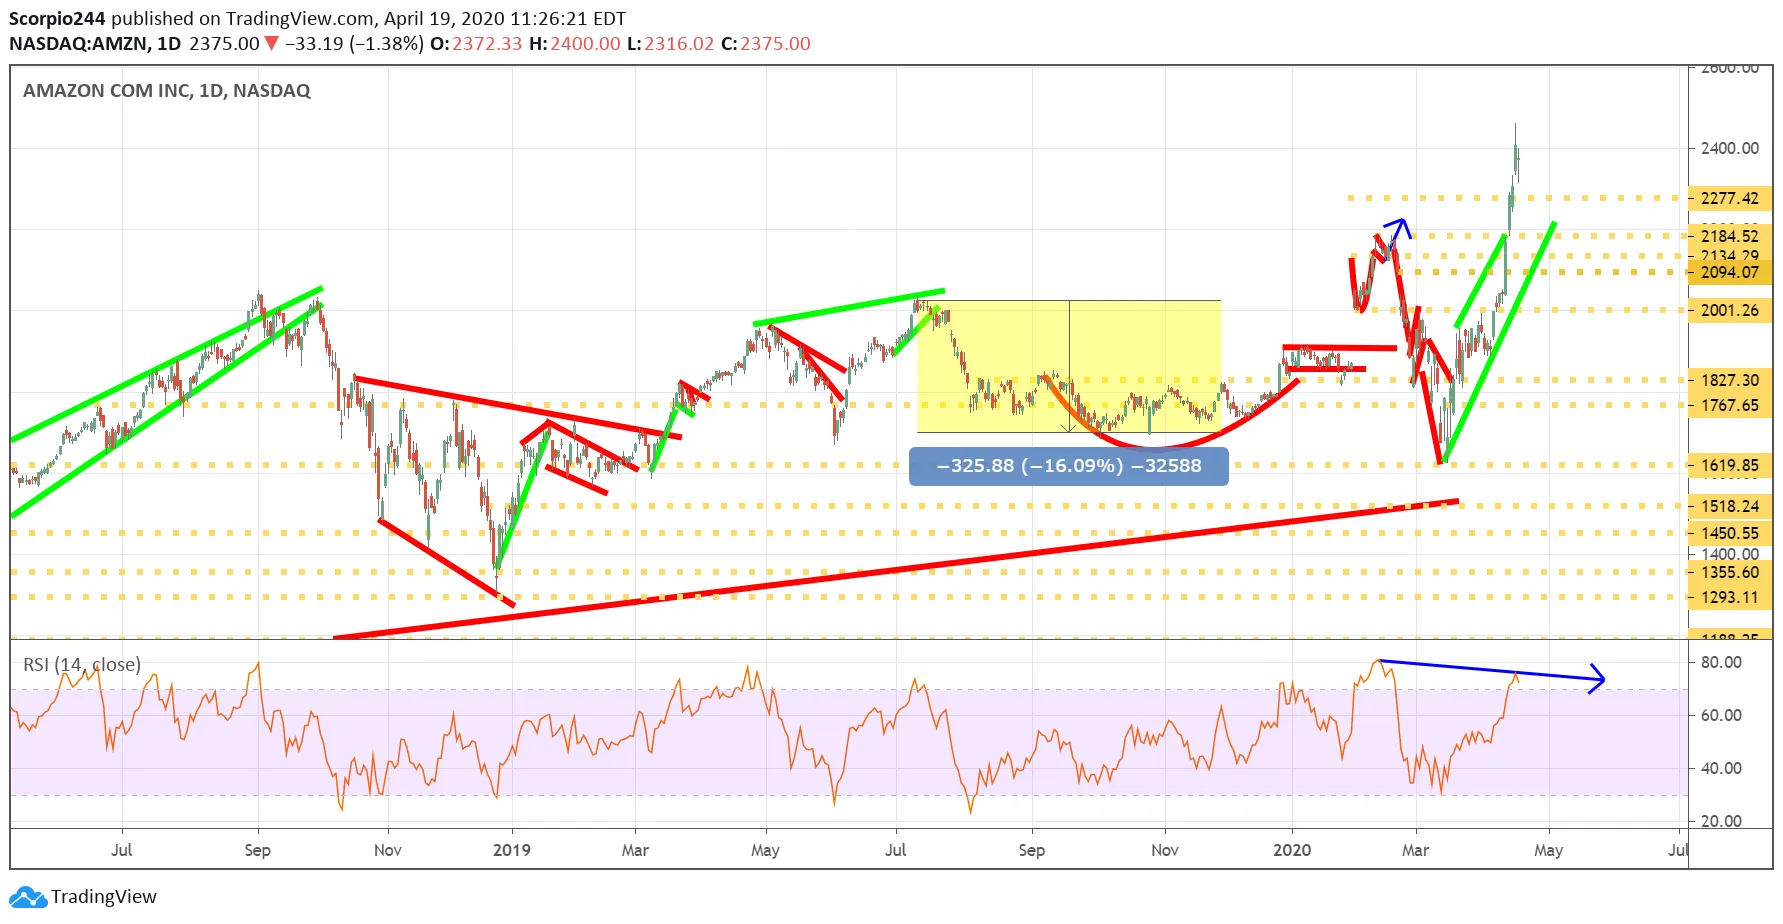
Amazon Daily Chart

AMD (AMD)

Advanced Micro Devices (NASDAQ:AMD) has an RSI that is also in a clear downtrend as well, and it too is forming a bearish divergence, suggesting the recent AMD is not likely to last and results in the shares pulling back towards $50.90.
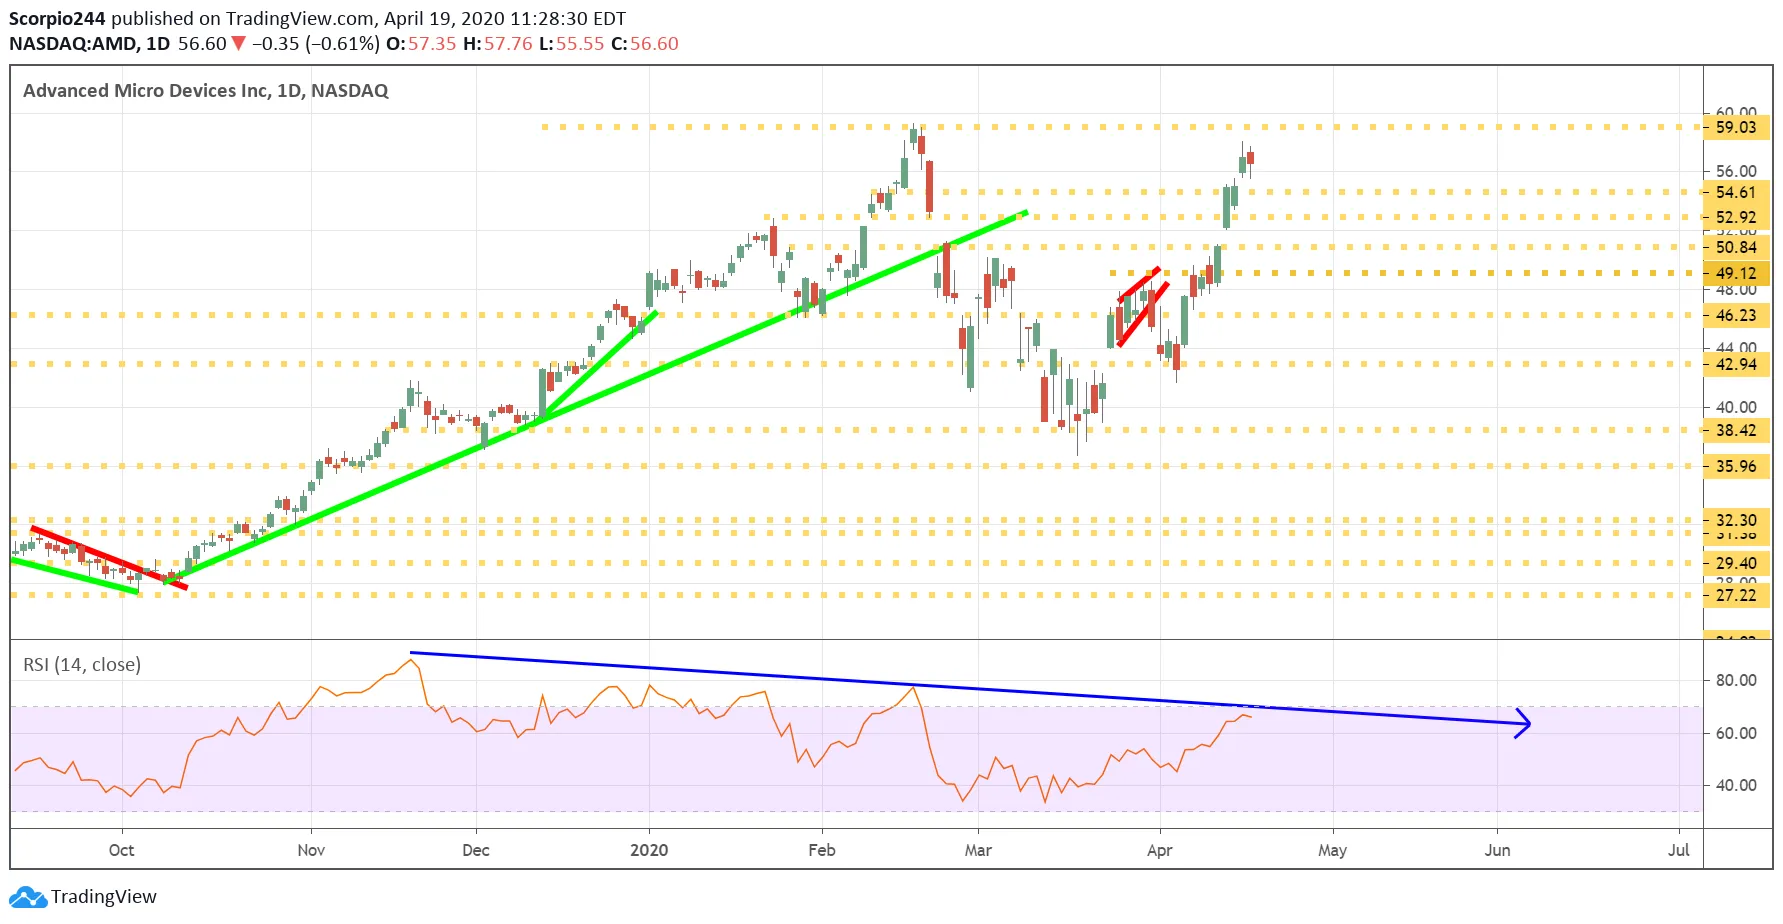
Amd Daily Chart

Shopify (SHOP)

3rd party Ad. Not an offer or recommendation by Investing.com. See disclosure here or remove ads .

Shopify (NYSE:SHOP) surged last week too, but like the others, it also has a bearish divergence with the RSI failing to make a new high and now trending lower. It would indicate that momentum in Shop is shifting from bullish to bearish, and the shares start trending lower in the weeks ahead. Perhaps back to the trend line around $440.
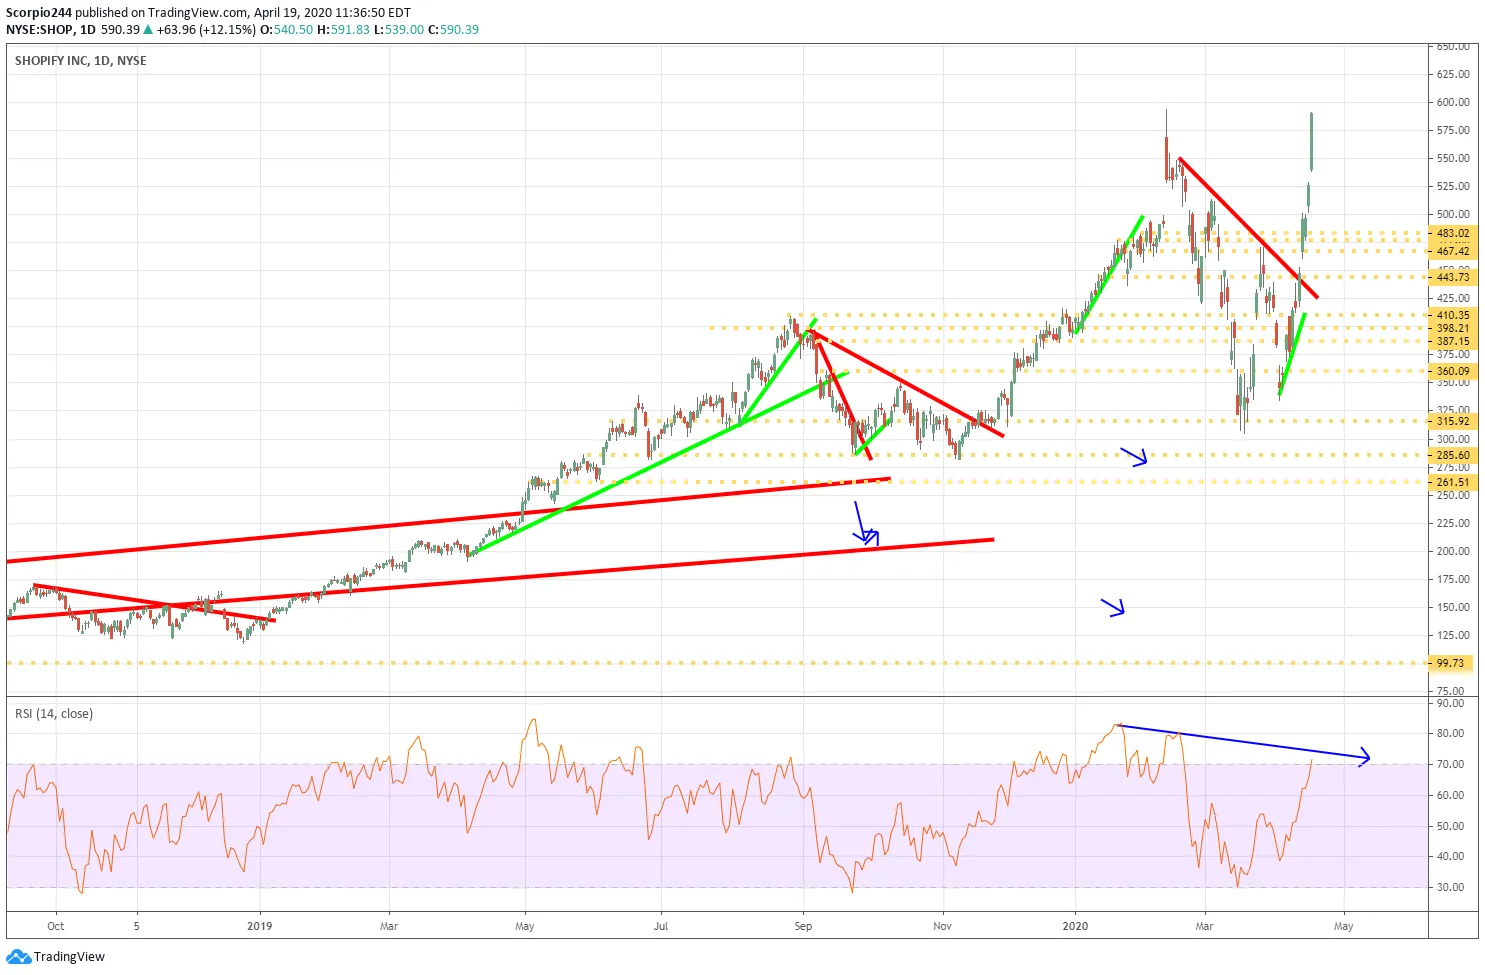
Shopify Inc Daily Chart

Apple (AAPL)

Apple's (NASDAQ:AAPL) RSI has also stalled out in recent days, and there is a gap for the stock to fill around $272.
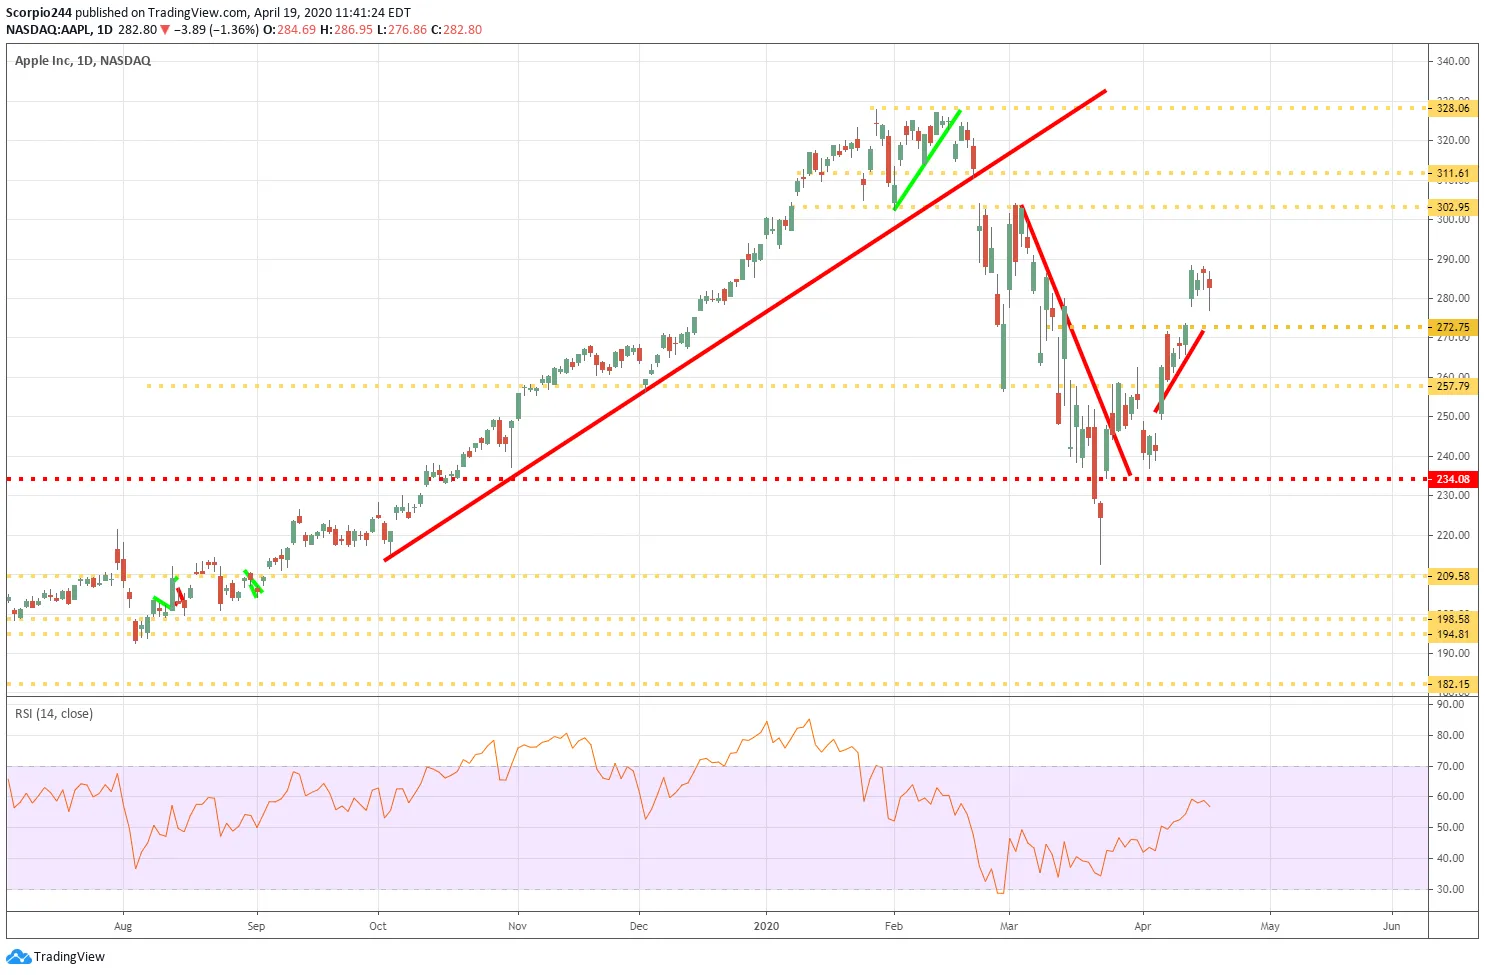
Apple Inc Daily Chart

JD.com (JD)

JD.com (NASDAQ:JD) has also hit overbought levels, and like the others, the RSI is now trending lower despite the stock hitting a new high. It would indicate that the stock turns lower and heads towards $42.85 in the week ahead.
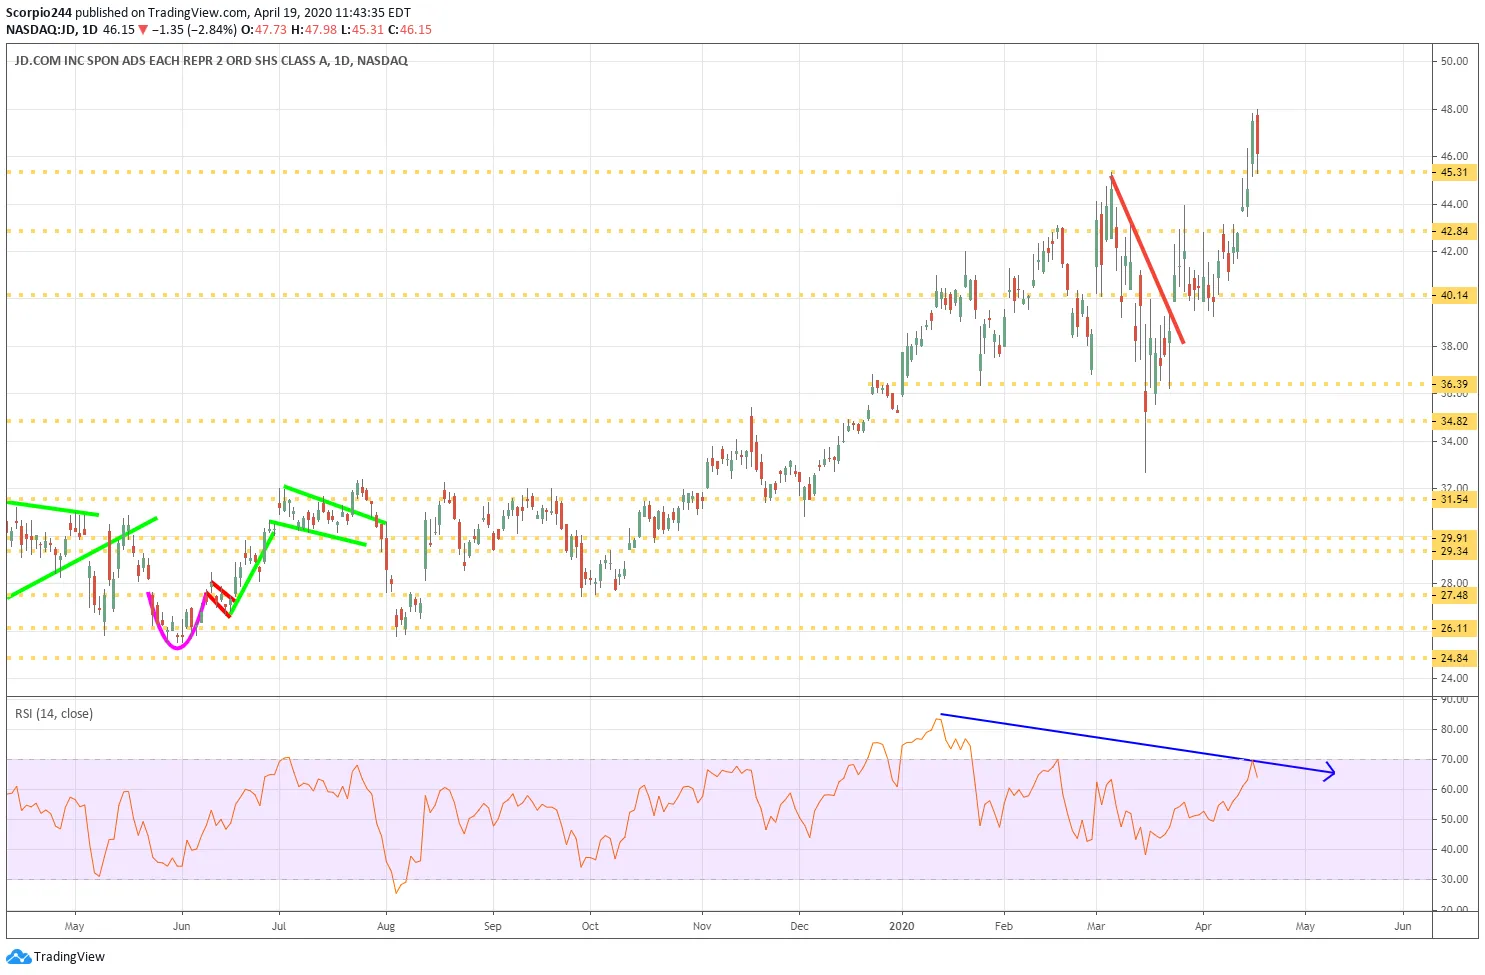
JD.Com Daily Chart

Original Post

Latest comments

Risk Disclosure: Trading in financial instruments and/or cryptocurrencies involves high risks including the risk of losing some, or all, of your investment amount, and may not be suitable for all investors. Prices of cryptocurrencies are extremely volatile and may be affected by external factors such as financial, regulatory or political events. Trading on margin increases the financial risks.
Before deciding to trade in financial instrument or cryptocurrencies you should be fully informed of the risks and costs associated with trading the financial markets, carefully consider your investment objectives, level of experience, and risk appetite, and seek professional advice where needed.
Fusion Media would like to remind you that the data contained in this website is not necessarily real-time nor accurate. The data and prices on the website are not necessarily provided by any market or exchange, but may be provided by market makers, and so prices may not be accurate and may differ from the actual price at any given market, meaning prices are indicative and not appropriate for trading purposes. Fusion Media and any provider of the data contained in this website will not accept liability for any loss or damage as a result of your trading, or your reliance on the information contained within this website.
It is prohibited to use, store, reproduce, display, modify, transmit or distribute the data contained in this website without the explicit prior written permission of Fusion Media and/or the data provider. All intellectual property rights are reserved by the providers and/or the exchange providing the data contained in this website.
Fusion Media may be compensated by the advertisers that appear on the website, based on your interaction with the advertisements or advertisers.
© 2007-2024 - Fusion Media Limited. All Rights Reserved.