Tuesday, March 8: Dick`s Sporting Goods Inc (NYSE:DKS)
![]()
![]()
Wednesday, March 9: Square Inc (NYSE:SQ)
![]()
Thursday, March 10: Ulta Salon Cosmetics & Fragrance (NASDAQ:ULTA), Bojangles Inc (NASDAQ:BOJA)
![]()
![]()
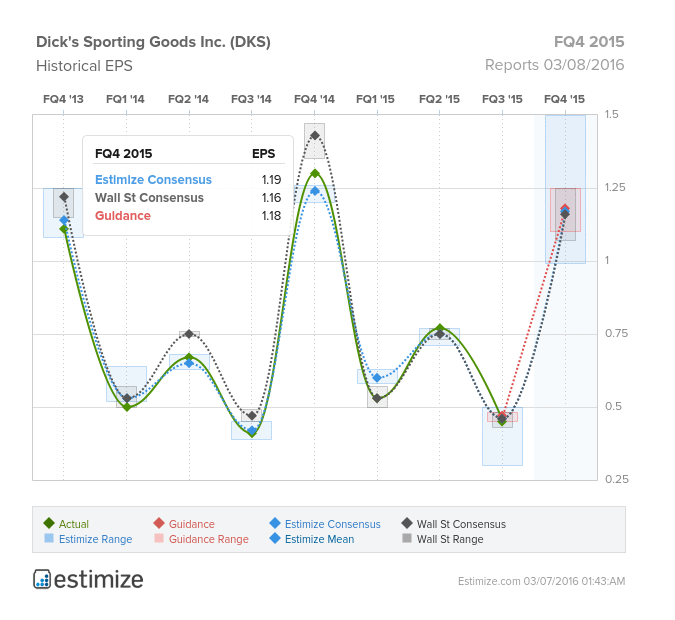
Dick’s Sporting Goods (DKS)
Consumer Discretionary - Specialty Retail | Reports March 8, before the open.
The Estimize mean calls for EPS of $1.19, 3 cents higher than Wall Street, with revenue expectations of $2.278 billion right in line with the Street. The Select Consensus on the other hand, is showing a more modest beat of 1 cent. The Estimize community has maintained a pessimistic stance on Dick’s, revising EPS estimates down 8% since the company last reported. Compared with the same period last year, current estimates predict a decline in profitability of 8%. On average, the company has consistently failed to beat expectations, only beating the Estimize consensus in 29% of recorded quarters.

What To Watch: Ahead of Dick’s Q4 earnings, rival sporting good store Sports Authority filed for bankruptcy, preparing to shut the doors on 140 of its locations. Dick’s is already said to be in discussions to acquire Sports Authority, which would leave them as the leading sporting goods retailer. In the meantime, the company has improved year over year projections from the success of its omni channel network, merchandising strategies and increasing focus on powerful marketing. Last quarter, the company reported 10% YoY earnings growth while consolidated comp inched up 0.4%, way below the company’s guidance of 1-3%. That said, e-commerce has been a bright spot for Dick’s, constituting 8% of sales. Its healthy financial status and minimal debt have kept the company afloat amidst weaker than expected earnings and guidance. Fourth quarter earnings this Wednesday will let investors know how the company has dealt with a soft holiday season and macroeconomic volatility.
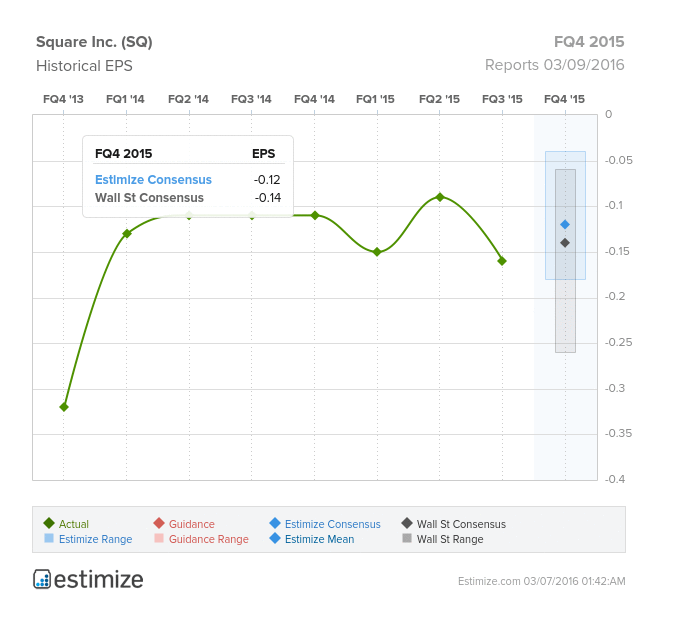
Square (SQ)
Information Technology - IT Services | Reports March 9, after the close.
The Estimize community calls for EPS of -$0.12 and revenue of $323 million, 2 cents higher than the Street on the bottom line, and roughly $18 million lower on the top line. However our Select Consensus is showing a more robust sales estimate of $341.21 million. In its first publicly reported quarter, the Estimize community has been bearish on Square’s profitability, revising EPS estimates down 37% in the past 3 months. Compared to the same period last year, Square is expected to report a 12% loss on the bottom line while sales are predicted to grow 27%.

What to Watch: In the face of volatile markets, Square’s first earnings report as a public company will tell us what to make of the company. Based on the stock’s ups and downs, early inclinations aren’t promising. Despite missing its anticipated $17 IPO price, shares performed remarkably well only to fall back toward its $9 IPO price at the start of 2016. The Jack Dorsey-led company has had trouble proving it can be more than a payment merchant for small businesses and the common person. Currently payment processing services makes up 95% of the company’s revenue while software and data products make up the remaining 5%. Software and data are expected to be a cash cow moving forward, as the company leverages these services to its existing user base. However, growth has not come easily for the mobile payment company. Prior to its IPO, the company revealed that the rate of revenue growth had slowed down in each quarter of 2015. Square did get a boost this week when Visa revealed it had a 9.99 % stake in the Class A shares of Square. Following the revelation, shares surged nearly 10%. Investors will be keen to know whether Jack Dorsey is leading Square in the right direction or down the rabbit hole he’s taken Twitter (NYSE:TWTR).
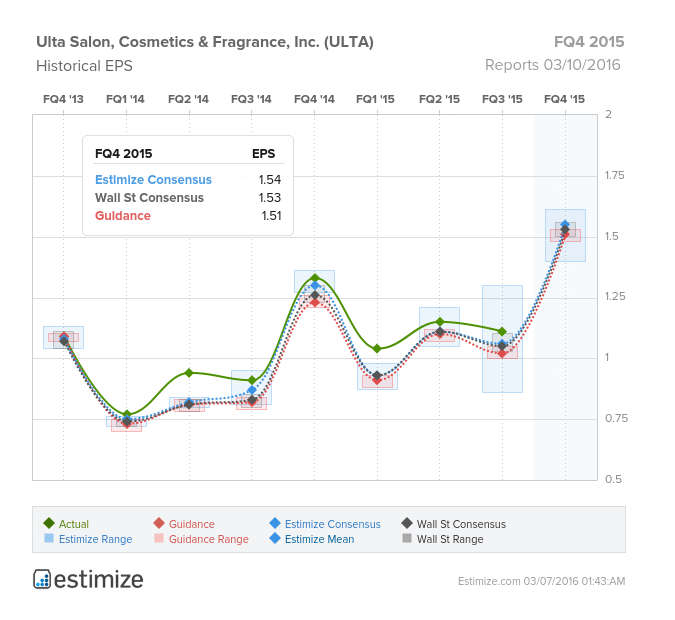
Ulta Salon, Cosmetics & Fragrance (ULTA)
Consumer Discretionary - Specialty Retail | Reports March 10, after the close.
The Estimize community is looking for EPS of $1.54 and revenue of $1.24 billion, a penny higher than the Street on the bottom-line, but in-line on sales. The Select Consensus is slightly more bullish, with EPS of $1.55. Ulta has seen favorable revisions activity of late, with earnings growing 6% and sales up 7%. Compared with Q4 2014, this predicts a YoY increase on the bottom line by 18% while sales are prepared to grow 18%. Historically the beauty company has consistently beat expectations, trumping Estimize 81% and Wall Street for 86% of recorded quarters.

What to Watch: Despite the overall weakness in consumer spending, beauty products have held strong with companies like Ulta and Sephora leading the way. Ulta is coming off its 8th consecutive quarter, beating on both the top and bottom line. The recent string of strong performances can be attributed to robust online traffic and sales. Overall in Q4 2014, online traffic was up 48%, sustained by effective use of targeted emails and promotions. Last quarter, the beauty products retailer posted a 12.8% increase in total sales store sales in which retail SSS were up 10.8%. Shares of Ulta have steadily followed the upbeat earnings, soaring 22% in 2016 alone. Yet, women fragrances have been a source of concern for the company with the category turning sharply negative to -7.8% compared to gains reported last quarter. Ulta’s market position, strategic outlook, and burgeoning cosmetics and beauty care products should be enough to mask the uncertainty in its sluggish fragrances segment.
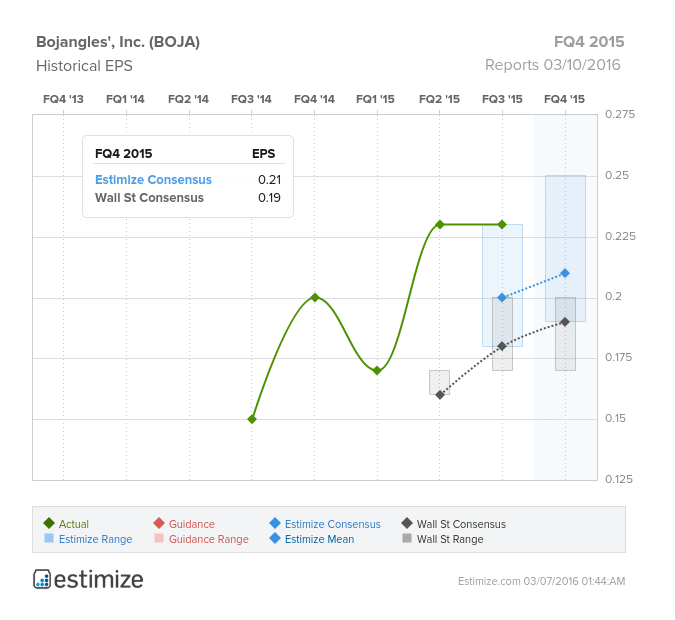
Bojangles’ (BOJA)
Consumer Discretionary - Hotels, Restaurants and Leisure | Reports March 10, after the close.
The Estimize Select Consensus calls for EPS of $0.21, 2 cents higher than Wall Street, while revenue expectations of $128.93 million are roughly in line with the Street’s consensus. The Estimize community has been optimistic on Bojangle’s profitability in the past three months, revising EPS estimates up 5%. Compared with Q4 2014, this predicts a YoY increase on the bottom line of 6% while sales are looking to increase 10%. In its short history as a traded company, Bojangles has beaten both Estimize and Wall Street’s earnings estimates 100% of the time.

What to Watch: Bojangles is coming into its fourth overall earnings report as a publicly traded company with expectations generally high. The quick service chicken and biscuit company currently operates 657 restaurants and is well positioned to expand its operations in preexisting Southeastern markets. With unit expansion growing at a 7-8% rate and low to mid-single-digit same store sales growth, Bojangles is poised to potentially double its total restaurants. The biggest obstacles in the way of its growth plans are a heavy concentration of restaurants in the Carolinas and high exposure to volatile chicken prices. Bojangles is also highly leveraged and utilizes leases to finance new store openings. Investors are hoping strong earnings will provide a much needed boost to share prices, which fell 37.6% in the past 12 months.
Do you agree with Wall Street or the Estimize community on these names?
