The markets continues to zig-zag in 2015…
The S&P 500 has now made its sixth 3.5% move since the end of December. Last week saw a reversal of the previous week’s downtrend as investors became hopeful that Greece & Ukraine would move toward more positive resolutions and the bounce in Energy prices would remove any land mines from equity, bond and loan portfolios. While Greece, Ukraine and Energy dominate the headlines and are currently dictating the major swings in the market, under the surface, there are interesting gains and losses among equity sectors and sub-sectors. Being a beneficiary of lower oil prices and US dollar based revenues is helping Consumer Discretionary (Retail, Housing & Autos) to outperform.
The Materials sector has also started to gain led by Miners, Chemical & Container/Packaging companies who both benefit from lower energy inputs. On the flip side, interest rate sensitive sectors such as Utilities & REITs have started to see profit taking as the strengthening U.S. economy causes Fed rate hike angst. Whether or not the first rate hike occurs in June or in 2016, it would seem that interest rate sensitive stocks, as well as bonds, will be playing defense in the markets as they justify every strong U.S. economic data point.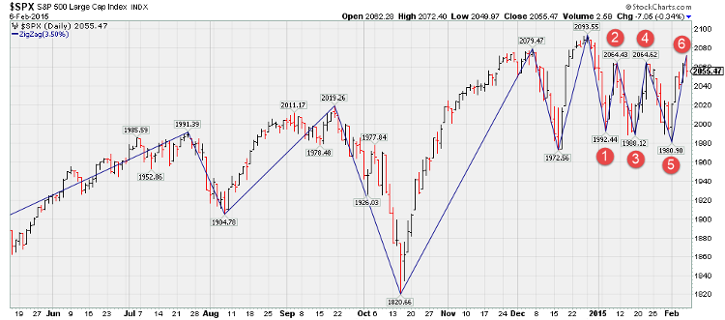
Another look at the zig-zags…
The equity market is carving out a high volatility pattern: since December, SPX has lost 5%, gained 6%, lost 5%, gained 4%, lost 4%, gained 4%, lost 4% and now gained nearly 5%. We haven’t seen this degree of indecision in more than 3 years. In the past, this pattern has meant that the market is either in the process of changing trend (in this case, from up to down) or it is in a long period of consolidation. There’s no clear way to know which one. In the late 1990s, a long consolidation period within a trading range of about 10% happened in 1994, 1996, 1997 and 1999. We haven’t seen this pattern recently, but it’s hardly unusual
Bulls will see a base. Bears will see a top. Confirmation bias.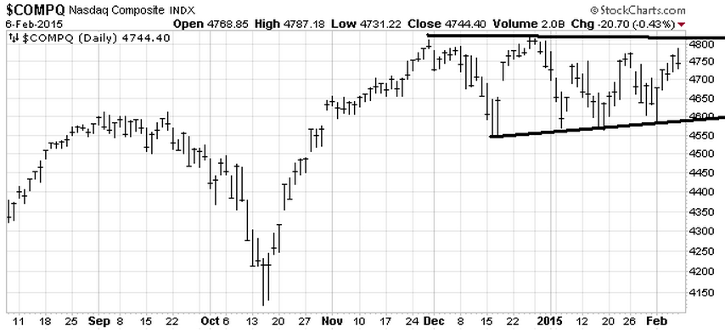
One thing that hasn’t left the market has been its volatility across all asset classes…
@VicNiederhoffer: major lesson of week. shocking moves will occur e.g. in last 4 days bonds down 4 big in 4 days, crude up 20%, gold down $50, spu up 60 big
Below, J.P. Morgan illustrates the extreme volatility in Oil & Treasury Yields. Will Equity vol join the fun?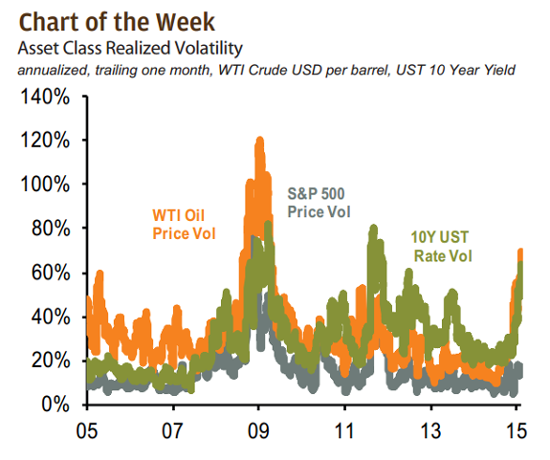
If you are long Risk, you had better pick up another bottle of Ouzo on the way home…
Greek Prime Minister Alexis Tsipras reaffirmed his government’s rejection of the country’s international bailout program two days before an emergency meeting with the euro area’s finance ministers. Tsipras vowed to increase the minimum wage, restore the income tax-free threshold and halt infrastructure privatizations in a speech that sets him on a collision course with the country’s creditors. “It is the irrevocable decision of our government to honor the mandate of the Greek people and negotiate an end to the European Union’s austerity,” Tsipras said in an address to parliament marking the start of a three-day debate on his government’s policy platform
Greece is now playing hardball. Will Germany give in to keep the EU intact or will Greece leave & borrow from Russia?
“The euro is fragile, it’s like building a castle of cards, if you take out the Greek card the others will collapse… I would warn anyone who is considering strategically amputating Greece from Europe because this is very dangerous. Who will be next after us? Portugal? What will happen when Italy discovers it is impossible to remain inside the straitjacket of austerity?” – Greek Finance Minister Yanis Varoufakis
(Reuters)
The uncertainty is causing havoc in the Greek financial markets…
@FerroTV: Greek bonds taking a beating. 3-Year yield through 20%.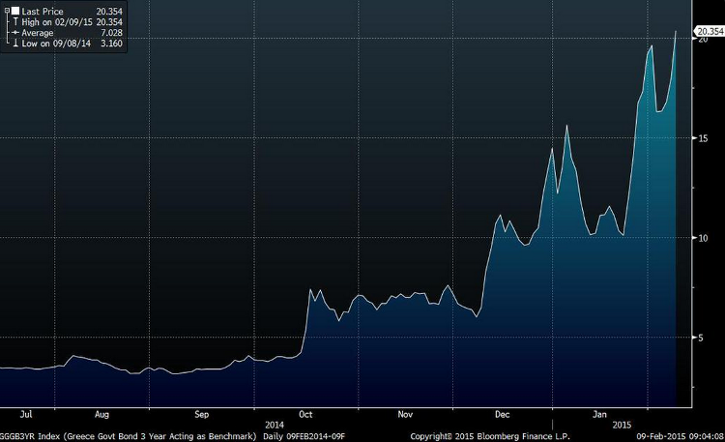
Less than 2,500 kilometers away in Eastern Ukraine, tensions are escalating…
In Brussels and other European capitals, the fear of Vladimir Putin is becoming palpable. The mood has changed in a matter of weeks from one of hand wringing impotence over Ukraine to one of foreboding. The anxiety is encapsulated in the sudden rush to Moscow by Angela Merkel and François Hollande. To senior figures closely involved in the diplomacy and policy making over Ukraine, the Franco-German peace bid is less a hopeful sign of a breakthrough than an act of despair. “There’s nothing new in their plan, just an attempt to stop a massacre,” said one senior official. Carl Bildt, the former Swedish foreign minister, said a war between Russia and the west was now quite conceivable. A senior diplomat in Brussels, echoing the broad EU view, said arming the Ukrainians would mean war with Russia, a war that Putin would win. Announcing the surprise mission to Kiev and Moscow, Hollande sounded grave and solemn. The Ukraine crisis, he said, started with differences, which became a conflict, which became a war, and which now risked becoming “total war”
Meanwhile back in the U.S., Friday’s jobs data showed an economy shifting up a gear…
@JustinWolfers: This might just be the most perfect payrolls report ever. Strong jobs growth, helpful revisions, useful real wage growth, restrained nominal
@bencasselman: November’s crazy 423k gain may have been an outlier, but the trend in jobs is clearly positive.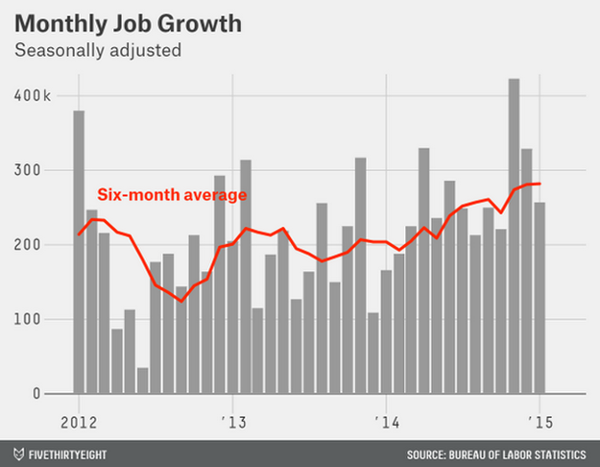
Costs to hire part-timers and the lack of growth in Retail jobs are affecting part time job growth. But the wage inflation will be helped by the surge in full-time jobs…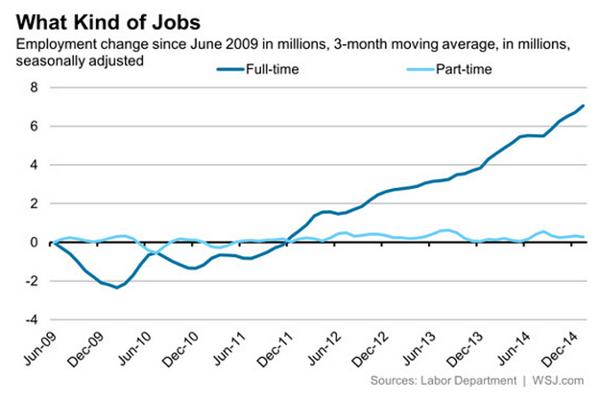
For the week, nearly every sector surged higher led by Energy, Financials and Materials. Utilities were aggressively for sale after making new all-time highs the previous week…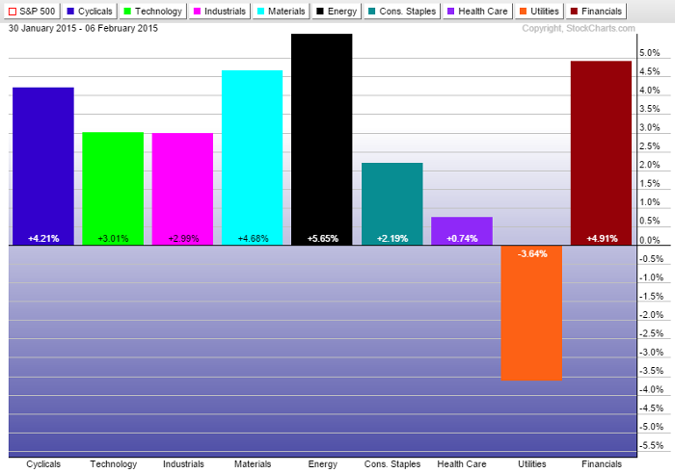
More broadly, energy commodity related sectors and economies saw the largest gains. And again, interest sensitive sectors lost…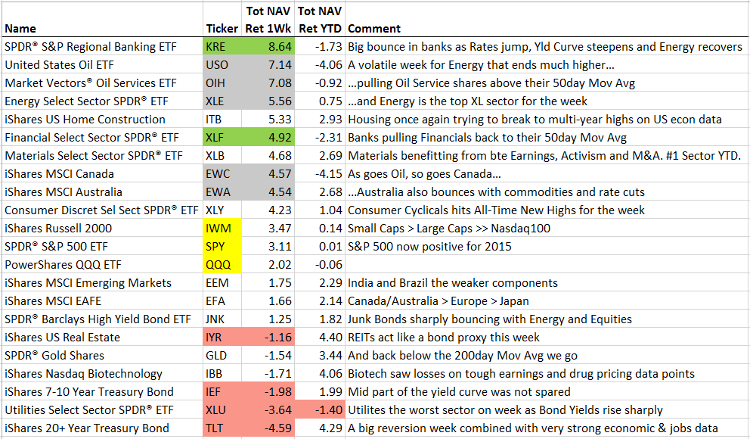
Crude Oil reversed hard last week; short covering or real discount buying?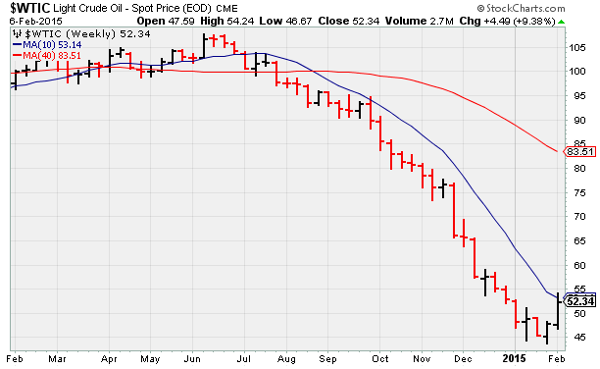
Oil rallied sharply this week with WTI crude gaining 7.2%. This was the biggest weekly increase since February 2011. Even with a nearly 9% pullback on Wednesday, it ended the week up almost 20% from the 29-Jan low. Brent settled 9.1% higher. While the recent wave of 2015 capex cuts from the majors was cited as a positive, the bigger tailwind was chalked up to falling U.S. oil rig counts. On Friday, Baker Hughes reported that the U.S. oil rig count fell 83 to 1,140, the lowest level since December 2011 and down nearly 30% since October.
However, there was a lot of skepticism about the read-through for production. BofA Merrill Lynch pointed out that there have yet to be meaningful rig count declines at the key Bakken, Eagle Ford and Permian plays. It also said that given the low and lagged sensitivity of supply to price, a much bigger price decline is necessary to curtail production and balance the market. Similarly, Morgan Stanley highlighted the fact that much of the drop in the oil rig count has come in low-yield vertical/directional rigs. Citi noted that the oil story is much more complicated than a single data series and still bearish given that U.S. crude production continues to rise and inventories continue to balloon. The inventory dynamic remained in focus as the EIA reported that crude oil supplies ended last week at their highest level in about 80 years.
Even with the excitement over the plunge in rig counts, U.S. production will grow by a million barrels in 2015 over 2014…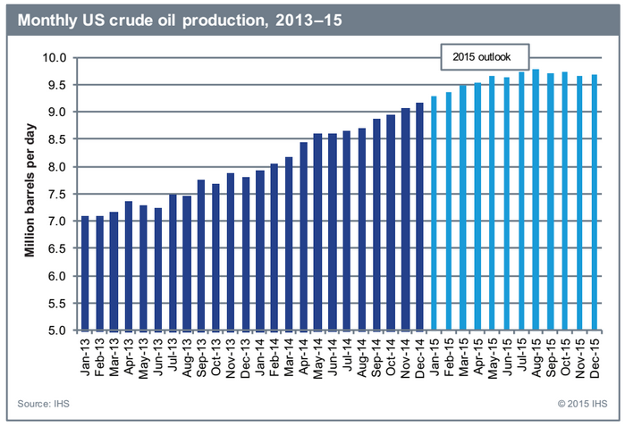
As a result Houston, we will still have an inventory problem…
In order to fully grasp the magnitude of the recent builds in crude oil inventories, we would note that over the last four weeks total stockpiles have increased by 30.667 million barrels. The chart below shows the rolling four-week changes in U.S. crude oil inventories going back to 1983. As shown, at no other point in the last 32 years have crude oil inventories seen a bigger increase over a four-week period.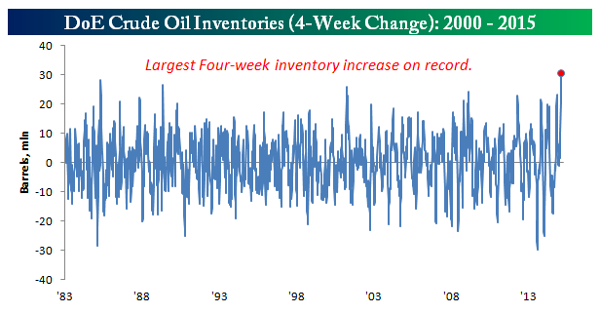
A thought-provoking long read by Jeremy Grantham on Oil…
Oil demand is notoriously insensitive to price in the short term but cumulatively and substantially sensitive as a few years pass. The Saudis are obviously expecting that these low prices will turn off U.S. fracking, and I’m sure they are right. Almost no new drilling programs will be initiated at current prices except by the financially desperate and the irrationally impatient, and in three years over 80% of all production from current wells will be gone!
Thus, in a few months (six to nine?) I believe oil supply is likely to drop to a new equilibrium, probably in the $30 to $50 per barrel range. For the following few years, U.S. fracking costs will determine the global oil balance. At each level, as prices rise more, fracking production will gear up. U.S. fracking is unique in oil industry history in the speed with which it can turn on and off. In five to eight years, depending on global GDP growth and how quickly prices recover, U.S. fracking production will start to peak out and the full cost of an incremental barrel of traditional oil will become, once again, the main input into price. This is believed to be about $80 today and rising. In five to eight years it is likely to be $100 to $150 in my opinion. U.S. fracking reserves that are available up to $120 a barrel are probably only equal to about one year of current global demand. This is absolutely not another Saudi Arabia.
If you are a non-dollar investor, then you are also watching the moves in Energy very closely…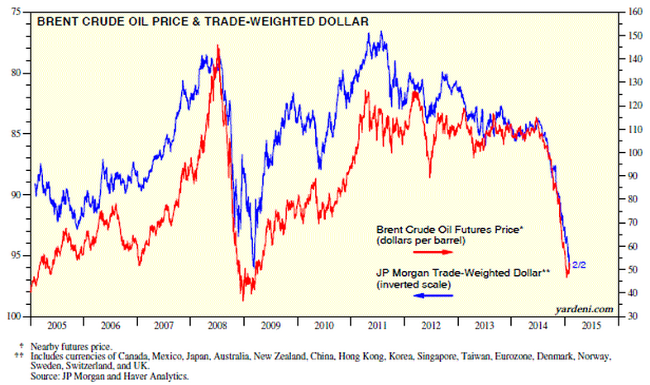
As mentioned, someone pulled a big plug out of Utility stocks on Friday…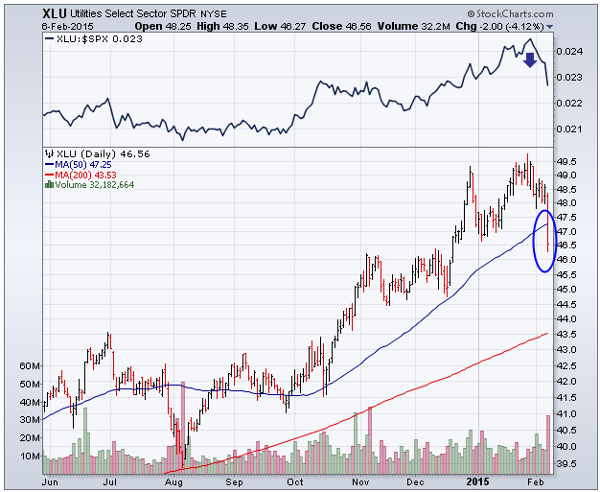
Bond prices fell sharply on Friday as yields surged. Chart 5 shows the 20+Year Treasury Bond iShares (ARCA:TLT) falling sharply in heavier trading. That made utilities the day’s weakest stock group (and the only sector to end the week in the red). Chart 6 shows the Utilities Sector SPDR (NYSE:XLU) tumbling 4% on Friday in heavy trading. Its relative strength line (top of chart) also fell sharply. The XLU broke its 50-day average for the first time in four months. Utilities compete with bonds for yield, and are hurt when rates jump. REITs, which are also hurt by rising rates, lost -3% on Friday.
Also something to watch, the ever flattening yield curve made a sharp reversal last week…
The trend is still toward flattening but keep an eye for a permanent reversal which would help bank stocks and other spread investors.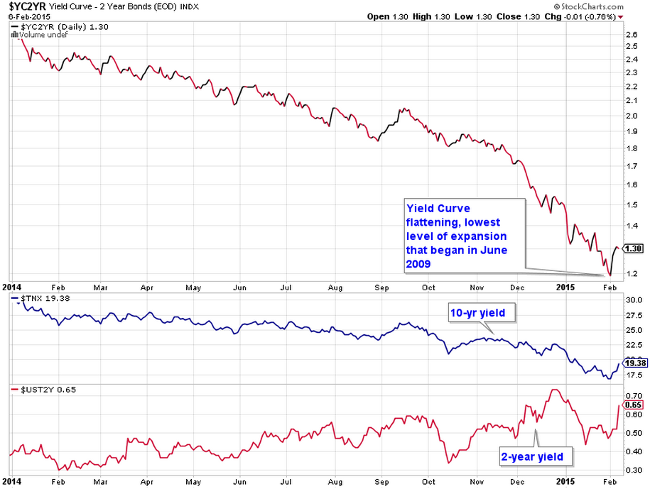
As mentioned earlier, Consumer Discretionary is now driving the market…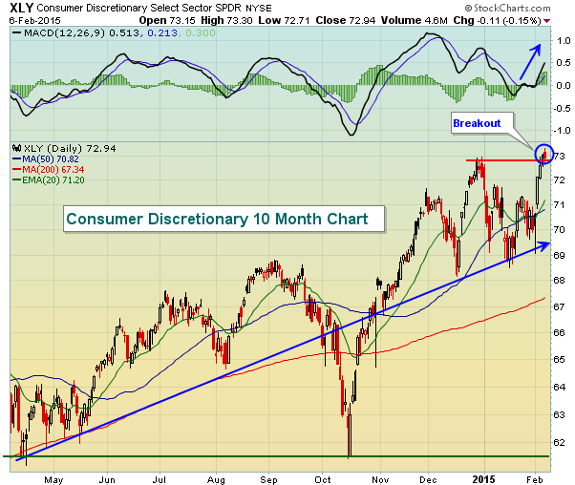
There’s been much said and written about rapidly-declining crude oil prices (WTIC). But one thing makes perfect sense to me. When American consumers save TONS of money when filling up at the pump, they tend to spend it elsewhere. It’s simply what we like to do – SPEND! So it’s not too surprising to me that many consumer discretionary companies are beginning to see huge benefits in terms of price appreciation.
Another sector that is now populating the all-time high lists is Aerospace and Defense…
Their performance should not be surprising given the profit surges at their Airline customers.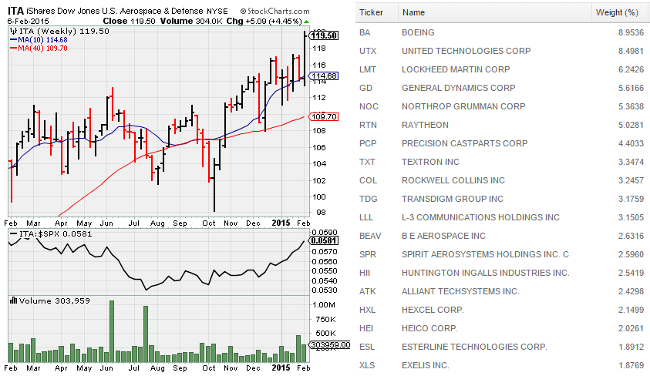
Still one of the most conflicting items in the financial markets is between Equities and Junk Bonds…
I mention high yield credit often in the weekly note because typically the markets move in tandem and thus one can help predict the direction of the other. But since the middle of 2015, this correlation has been broken. I still believe the two must converge but the question is how. Will Stocks fall, Junk rise or a bit of both? Maybe Junk found its low in December on the heels of the Energy price break. If so, this could be a top asset for 2015, especially with the overall strength in the U.S. economic data. Here is a good chart showing the divergence from the team at Leuthold…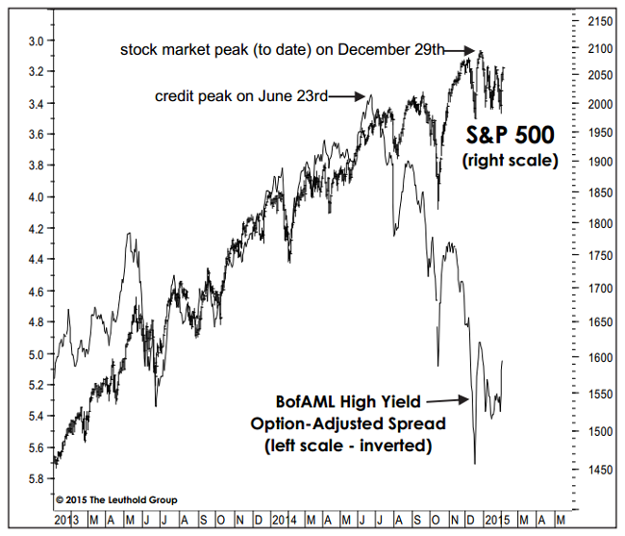
(The Leuthold Group)
One reason that High Yield could win is because its bonds still have a POSITIVE yield, unlike Finland…
Finland became the first government to auction five-year notes at a negative yield in the history of the euro area as investors took advantage of the European Central Bank’s planned sovereign-bond purchases. Finland’s average yield of minus 0.017 percent in an auction of September 2020 bonds compares with a low of 0.04 percent for Germany and 0.025 percent for Austria, according to data compiled by Bloomberg. The northernmost euro member raised 1 billion euros ($1.1 billion), selling 0.375 percent securities, with bids exceeding supply by 1.7 times, the Helsinki-based Treasury said on its Bloomberg page.
Actually, now 35% of Europe government debt now has negative yields…
@Schuldensuehner: Why investors buy bonds w/ negative yields and pay for lending money.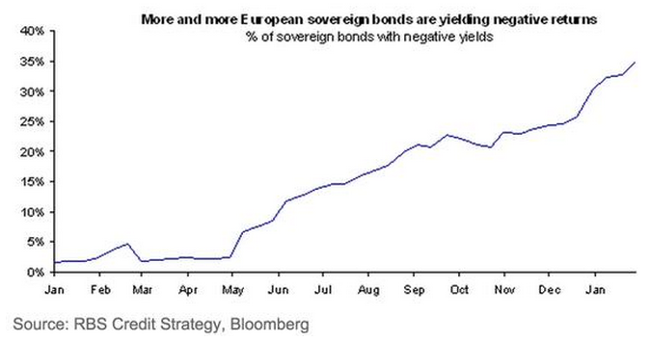
And as global investors look for positive returns, a New York City hotel sets a new price record…
New York’s Baccarat Hotel has yet to check in a single guest, but it is about to become the most highly valued hotel in the U.S. after a Chinese insurer agreed to buy it for more than $230 million. Sunshine Insurance Group Co. is paying real-estate mogul Barry Sternlicht’s firm and a partner more than $2 million a room for the Midtown Manhattan property, according to people familiar with the matter. One person said the valuation beats the previous record set by the Plaza Hotel, the New York landmark that was sold in 2012 to India’s Sahara Group for $2.04 million a room, according to hotel data tracker STR Analytics.
The Baccarat is the latest trophy property to wind up in the hands of Chinese investors in recent months as buyers take advantage of new rules allowing them to invest more easily abroad. Real-estate brokers and analysts said Chinese companies see luxury hotels, especially in major global capitals, as long-term investments that can provide steady income in a period of low interest rates
Even fine art set a new price record last week…
A colorful painting of two Tahitian women by Paul Gauguin has reportedly been sold by a Swiss family foundation to a group of state museums in Qatar for nearly $300 million, a record sum for a single work of art. The price would best the roughly $250 million that Qatar paid three years ago for Paul Cezanne’s “The Card Players,” and underscores the purchasing power and ambitions of the nation.
Late Night Talk Show Host Tweet of the Week…
@ConanOBrien: I’m shocked. Back when Brian Williams and I killed Osama Bin Laden, he seemed like an honest guy.
Finally, AC/DC is 4 years older than my first computer. Angus Young’s guitar opened the Grammys last night. Radio Shack also had a busy weekend, but for the wrong reasons. Lesson learned: Superior Content Rules
Disclaimer: The information presented here is for informational purposes only, and this document is not to be construed as an offer to sell, or the solicitation of an offer to buy, securities. Some investments are not suitable for all investors, and there can be no assurance that any investment strategy will be successful. The hyperlinks included in this message provide direct access to other Internet resources, including Web sites. While we believe this information to be from reliable sources, 361 Capital is not responsible for the accuracy or content of information contained in these sites. Although we make every effort to ensure these links are accurate, up to date and relevant, we cannot take responsibility for pages maintained by external providers. The views expressed by these external providers on their own Web pages or on external sites they link to are not necessarily those of 361 Capital.
