The year of 2016, for a veritable myriad of reasons, looks very good for gold and related assets.
First, while gold bullion recently traded below its summer low, about 75% of N:GDX component stocks are trading higher. That’s a classic technical bullish non-confirmation, it is significant.
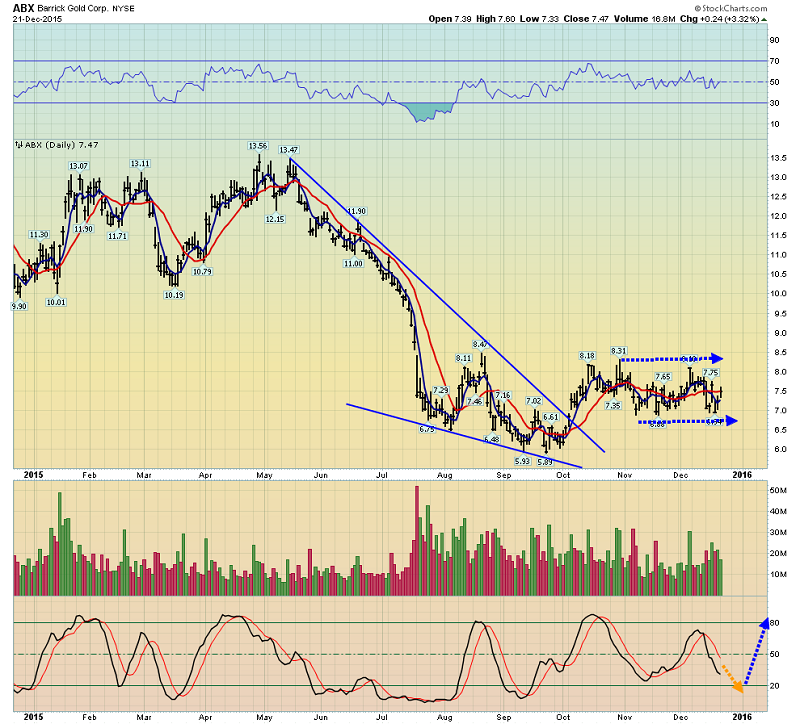
The company (N:ABX) has reduced debt levels significantly, and is trading sideways during tax season. That carries bullish implications for the entire precious metals sector.
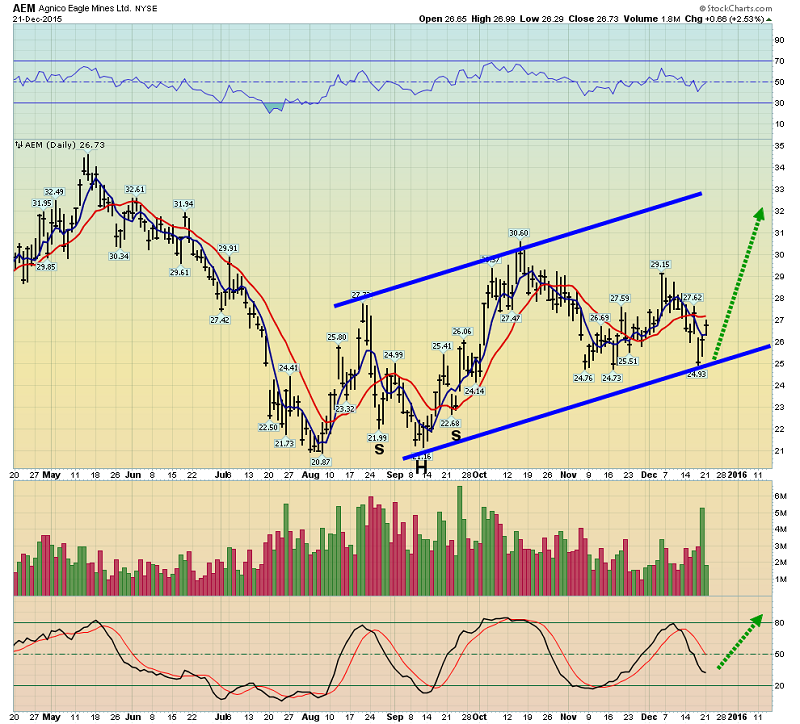
N:AEM: The “Golden Eagle” appears to be establishing an upchannel in the face of lower bullion prices, and the company does not engage in hedging.
For gold bullion itself, a substantial array of bullish price drivers appear set to take the “price discovery stage”.
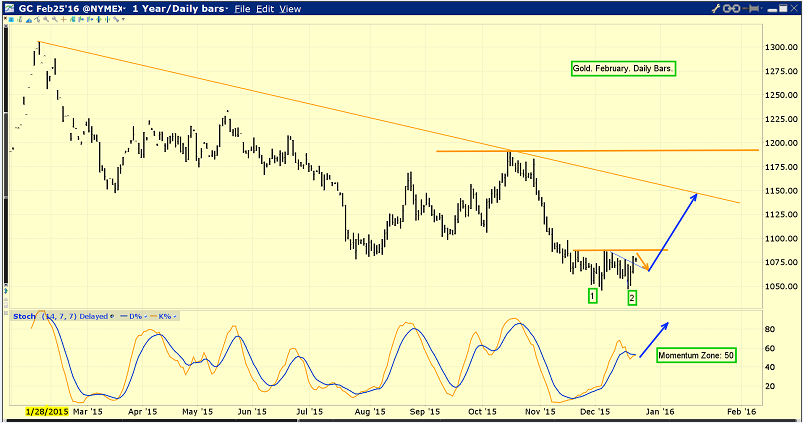
From a technical perspective, there’s a commodity-style double bottom pattern in play, and that may be part of something much bigger, and much more bullish.
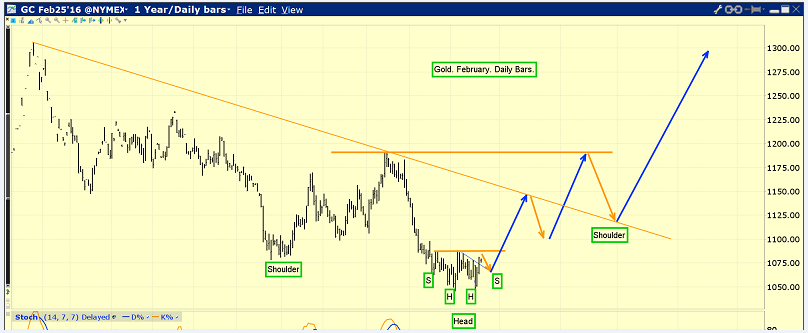
Gold appears to be steadily carving out a large inverse head and shoulders bottom formation.
Gold is traded as currency on major bank FOREX desks, but because it is a central bank reserve asset, it’s very difficult to assign clear cut bull or bear market labels to its price action.
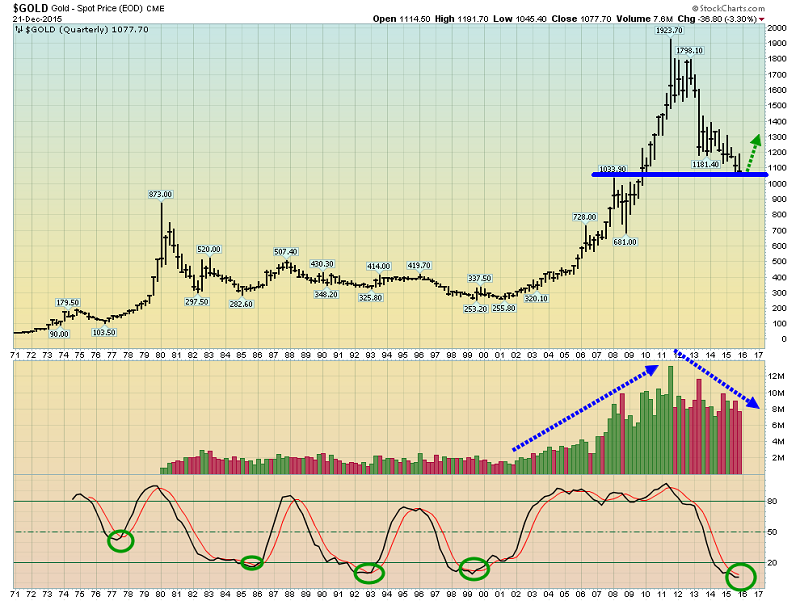
Regardless, volume must rise with a primary trend. If price declines and volume does not rise, the primary bull market remains intact.
That’s the quarterly bars gold chart. At some point in the future, the highs in the $1900 area will become a major support zone, as the $1033 area is now.
Note the rising volume with rising price, and declining volume, with declining price. The primary trend is unchanged, and it is bullish.
An analyst carries a degree of responsibility. When an investor in a major asset class has drawdowns, care must be taken not to break the spirit of that investor. Investor spirit needs to be nurtured and strengthened.
In that regard, when gold declined into significant quarterly bars support in 2008 at $728, my job was to nurture the spirit of gold community investors, so they could muster the intestinal fortitude required to hold positions, and buy more. I did that job to the best of my ability.
The Western gold community is now entering the year 2016, as gold approaches another mighty support zone, this time at $1033. It’s unknown whether gold enters that support zone, or rallies from just above it.
What is known is that this is a major buying area, and a generational low appears to be in the works for both the bullion and the miners. Intestinal fortitude, and nurturing of investor spirit, are all that is required now.
Many investors have asked me if US bond and real estate markets could be topping, now that the Fed is raising rates. The answer is that junk bonds have probably topped and are likely headed vastly lower. Real estate (except beachfront property) appears set to ooze lower in price, and it will probably do for several decades.
In regards to the US T-bond itself, the tools Janet Yellen is using to raise rates are somewhat supportive of long term bonds. I think the best way to summarize the T-bond market is that the party is ending, but rather than getting “blown away”, long term T-bonds are more likely to fade away, like the rotary phone did.
So, I would not short the T-bond. Shorting enthusiasts should focus on junk bonds and leveraged real estate.
Geopolitics is a bullish 2016 wild card, and the PBOC gold buy program looks set to continue relentlessly. The SGE gold fix is scheduled for a spring launch, and that coincidentally comes at the same time as cycle master Marty Armstrong predicts a horrific sovereign debt crisis will appear. Marty is widely followed by many money managers, and their liquidity flows can be sizable.
It can be persuasively argued that Indian demand is the most important big picture driver of the gold price. When India “sneezed” with a gold duties virus in 2013, the Western gold price immediately looked like it caught financial Ebola. For the past two years, India has suffered from drought, and that’s reduced the rate of demand growth significantly.
The bottom line for 2016 is, “Out with El Nino, and in with La Nina!” Bumper crops across India would create a huge surge in both official and unofficial gold market demand!
The 2000 stock market crash involved retail stock market investors. The 2008 crash involved institutional and local government OTC derivative investors. Each crisis is intensifying, and each crisis is affect the price of gold to a greater degree.
I’ve argued that the Fed must raise rates, to reign in the US government’s insane obsession with debt. If that creates a government debt crisis, so be it. Gold price parabola fans should know there is nothing more bullish for gold than a global sovereign debt crisis. Santa has been pretty good to the Western gold community during the 2015 tax season, and 2016 looks like it may be a truly golden year!
DISCLAIMER: Stewart Thomson is no longer an investment advisor. The information provided by Stewart and Graceland Updates is for general information purposes only. Before taking any action on any investment, it is imperative that you consult with multiple properly licensed, experienced and qualified investment advisors and get numerous opinions before taking any action. Your minimum risk on any investment in the world is: 100% loss of all your money. You may be taking or preparing to take leveraged positions in investments and not know it, exposing yourself to unlimited risks. This is highly concerning if you are an investor in any derivatives products. There is an approx $700 trillion OTC Derivatives Iceberg with a tiny portion written off officially. The bottom line: Are You Prepared?

