PSEi 2013 close: 5,889.83
PSEi 2014 close: 7,230.57
Before I start, let’s put things in perspective. How well did 2014 go for the index? How did it compare with our blog’s yearly technical analysis?
To find out, you have to review the reference link I’ve shared with all of you in December 30, 2013: http://www.tradingphoenix.net/2013/12/30/psei-the-year-ahead/ Do you see even a glimmer of benefit of technical analysis now?
2013 closed at 5,889.83, so thePSEi Indexstarted 2014 at the ground and worked its way up throughout last year. The result, as you know, is a strong 2014 finish well above the 7,000 level. A strong win for the bulls.
Will 2015 be better than 2014 for the PSEi?
I will attempt to answer this question by showing technical analysis, followed by a short list of factors or themes to watch out for in 2015.
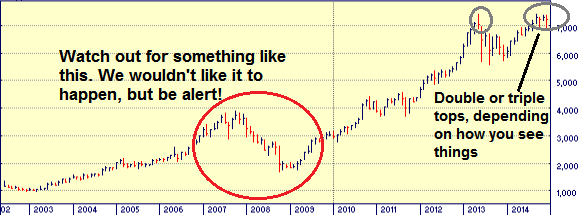
In the Monthly chart (below), we can see the index went into a consolidation (with considerable volatility) in the 4th quarter of 2014. The index posted a new all-time high in late September, so we now have a potential double or triple top in the chart. Is this a bad sign? No, not necessarily. We have to analyze the chart(s) in context before we make conclusions.

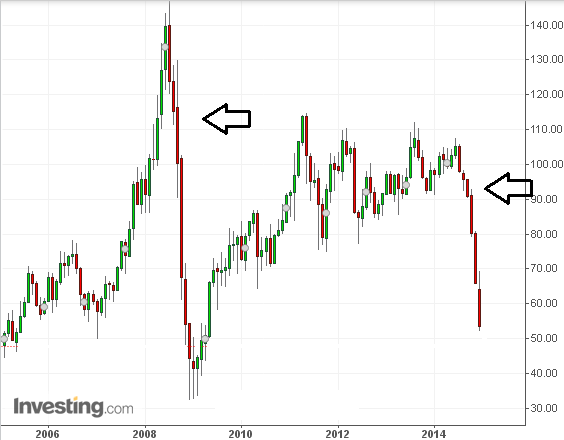
Compare the PSEi’s 2008 price action with the crude oil chart below:

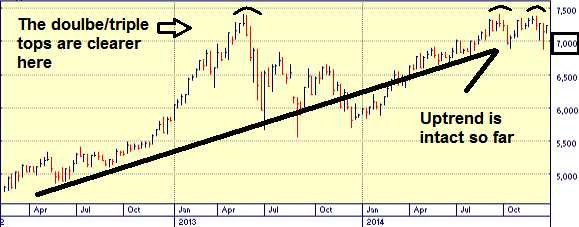
In the following Weekly chart, we can see the double/triple tops with much clarity. We can also see an intact uptrend amidst the backdrop of those tops. 2014 had a relatively smooth ride up right from the start, culminating in a late-2014 volatility/consolidation as the index tried to punch through the index highs.

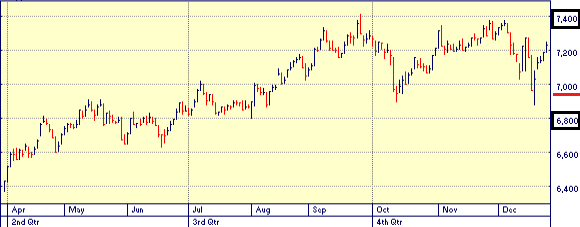
In the following Daily chart, we can see an even better look on the volatility that happened in late 2014. There were three attempts then to break through 7,400, but all of them were shut down by bears. The downside attempts through the 7,000 psychological level were quite nasty, but bulls manage to keep that support area on their side.

PSEi Daily chart, December 29, 2014
Key areas to watch:
Resistance: 7,400-7,500 (short-term), 8,000-9,000
Support: 6,800-7,000, 6,500, 6,000
Based on all the information mentioned, I would like to see initiative from the bulls to go for a quick attempt at the first resistance at 7,400-7,500 during the first quarter. This would give them substantial time to tackle 8,000. Any consolidation between 7,000 and 7,400 are ok, but bulls need to show dominance if this happens. Since we are close to unchartered territories, we would likely see the Key Areas List revised in the next 1-6months. Unlike last year, bulls have a good upper hand at the start of this year. The key battlegrounds for control are 7,000 level and the 7,400-7,500 area. There is even time to break past the 8,000 if certain things happen in a favorable order.
Cautious Optimism: Themes to Monitor
The PSE Index is in a much better position now compared to last year, however there are certain factors you need to consider this year. That is why a cautious optimism is in order. I have mentioned most of them last December.
1. Economic and geopolitical issues of and between US, Russia, China, and Europe
2. Crude oil bearish price trend. This could be an ominous sign of another global recession/depression. (check the oil chart above) In case most of you are not aware, preceding the 2008 financial crisis, crude oil plunged from $147.27 to $32.40 or nearly $115 in 6 months (July to December 2008).
3. Dominance of US has been falling apart: China has recently replaced the US as the number 1 economy in the world. Not to mention the ever-growing trillions of US debt, and Chinese Yuan’s growing dominance and prospect in becoming a world reserve currency.
4. Local front: potential further decline in inflation
5. Local front: 2015 is pre-election year
6. Asian front: 2015’s ASEAN economic integration (and APEC in the Philippines)
Be sure to stay updated on these developments as 2015 marches forward.
Everyone, Safe trading in 2015!
