
Basic Material stocks were the worst performing stock category within the recent six month. The sector had a performance of -0.7 percent while the S&P 500 increased 15.27 percent.
The fear of an economic slowdown mainly caused by China’s slowing growth is the main reason for this.
Investors can benefit from a falling stock price via short selling. Today I'm focusing on basic material dividend stocks with the highest short float ratios. I excluded all companies with a market capitalization below USD 2 billion.
The top 20 results have a float short ratio between 6 percent and 32.62 percent. Eight of the results still have a current buy or better rating.
Western Refining (WNR) has a market capitalization of $2.57 billion. The company employs 3,800 people, generates revenue of $9.503 billion and has a net income of $398.88 million. The firm’s earnings before interest, taxes, depreciation and amortization (EBITDA) amounts to $806.91 million. The EBITDA margin is 8.49 percent (the operating margin is 7.49 percent and the net profit margin 4.20 percent).
Financial Analysis: The total debt represents 20.56 percent of the company’s assets and the total debt in relation to the equity amounts to 56.10 percent. Due to the financial situation, a return on equity of 45.66 percent was realized. Twelve trailing months earnings per share reached a value of $5.40. Last fiscal year, the company paid $2.74 in the form of dividends to shareholders. WNR has a float short ratio of 32.62 percent.
Market Valuation: Here are the price ratios of the company: The P/E ratio is 5.75, the P/S ratio is 0.27 and the P/B ratio is finally 2.93. The dividend yield amounts to 1.57 percent and the beta ratio has a value of 0.99.
United States Steel (X) has a market capitalization of $2.62 billion. The company employs 39,000 people, generates revenue of $19.328 billion and has a net income of $-125.00 million. The firm’s earnings before interest, taxes, depreciation and amortization (EBITDA) amounts to $1.071 billion. The EBITDA margin is 5.54 percent (the operating margin is 1.28 percent and the net profit margin -0.65 percent).
Financial Analysis: The total debt represents 25.88 percent of the company’s assets and the total debt in relation to the equity amounts to 113.26 percent. Due to the financial situation, a return on equity of -3.55 percent was realized. Twelve trailing months earnings per share reached a value of $0.06. Last fiscal year, the company paid $0.20 in the form of dividends to shareholders. X has a float short ratio of 28.72 percent.
Market Valuation: Here are the price ratios of the company: The P/E ratio is 315.32, the P/S ratio is 0.13 and the P/B ratio is finally 0.71. The dividend yield amounts to 1.16 percent and the beta ratio has a value of 2.50.
Cliffs Natural Resources (CLF) has a market capitalization of $2.88 billion. The company employs 7,589 people, generates revenue of $5.872 billion and has a net income of $-757.70 million. The firm’s earnings before interest, taxes, depreciation and amortization (EBITDA) amounts to $1.266 billion. The EBITDA margin is 21.57 percent (the operating margin is -5.26 percent and the net profit margin -12.90 percent).
Financial Analysis: The total debt represents 29.87 percent of the company’s assets and the total debt in relation to the equity amounts to 87.53 percent. Due to the financial situation, a return on equity of -17.96 percent was realized. Twelve trailing months earnings per share reached a value of $-8.51. Last fiscal year, the company paid $2.16 in the form of dividends to shareholders. CLF has a float short ratio of 27.16 percent.
Market Valuation: Here are the price ratios of the company: The P/E ratio is not calculable, the P/S ratio is 0.45 and the P/B ratio is finally 0.53. The dividend yield amounts to 3.45 percent and the beta ratio has a value of 2.48.
Take a closer look at the full list of the basic material dividend stocks with highest float short ratio. The average P/E ratio amounts to 16.92 and forward P/E ratio is 12.39. The dividend yield has a value of 1.69 percent. Price to book ratio is 2.42 and price to sales ratio 1.40. The operating margin amounts to 11.67 percent and the beta ratio is 1.58. Stocks from the list have an average debt to equity ratio of 0.67.
Here is the full table with some fundamentals (TTM):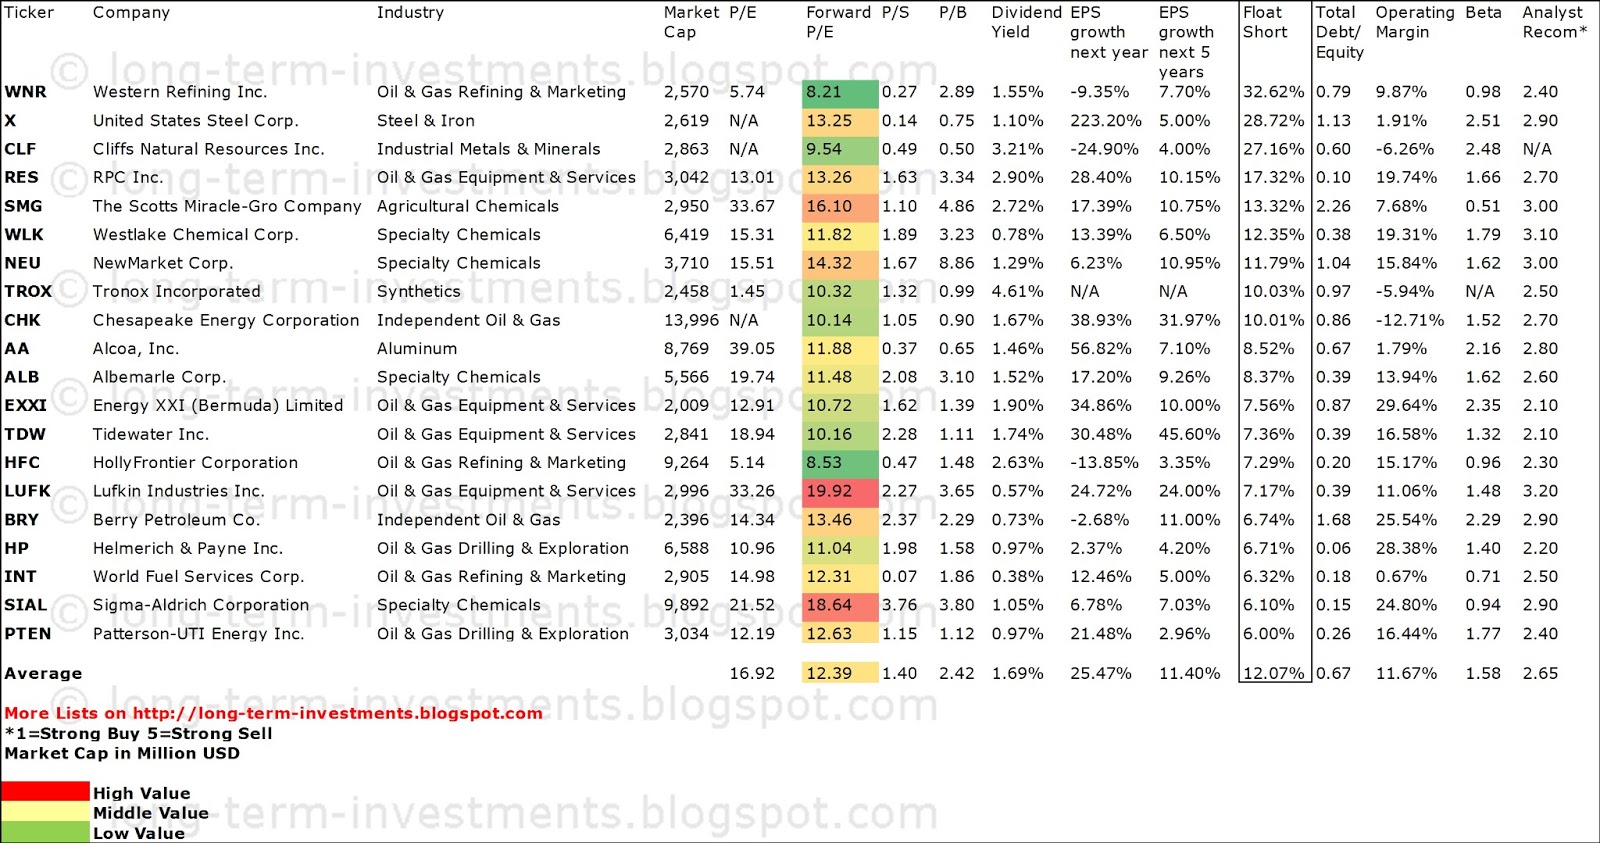
Related stock ticker symbols:
WNR, X, CLF, RES, SMG, WLK, NEU, TROX, CHK, AA, ALB, EXXI, TDW, HFC, LUFK,
BRY, HP, INT, SIAL, PTEN
Disclosure: I have no positions in any stocks mentioned, and no plans to initiate any positions within the next 72 hours. I receive no compensation to write about any specific stock, sector or theme.
- English (UK)
- English (India)
- English (Canada)
- English (Australia)
- English (South Africa)
- English (Philippines)
- English (Nigeria)
- Deutsch
- Español (España)
- Español (México)
- Français
- Italiano
- Nederlands
- Português (Portugal)
- Polski
- Português (Brasil)
- Русский
- Türkçe
- العربية
- Ελληνικά
- Svenska
- Suomi
- עברית
- 日本語
- 한국어
- 简体中文
- 繁體中文
- Bahasa Indonesia
- Bahasa Melayu
- ไทย
- Tiếng Việt
- हिंदी
20 Basic Material Dividend Stocks With High Short Ratios
Published 06/16/2013, 05:11 AM
Updated 07/09/2023, 06:31 AM
20 Basic Material Dividend Stocks With High Short Ratios
3rd party Ad. Not an offer or recommendation by Investing.com. See disclosure here or
remove ads
.
Latest comments
Install Our App
Risk Disclosure: Trading in financial instruments and/or cryptocurrencies involves high risks including the risk of losing some, or all, of your investment amount, and may not be suitable for all investors. Prices of cryptocurrencies are extremely volatile and may be affected by external factors such as financial, regulatory or political events. Trading on margin increases the financial risks.
Before deciding to trade in financial instrument or cryptocurrencies you should be fully informed of the risks and costs associated with trading the financial markets, carefully consider your investment objectives, level of experience, and risk appetite, and seek professional advice where needed.
Fusion Media would like to remind you that the data contained in this website is not necessarily real-time nor accurate. The data and prices on the website are not necessarily provided by any market or exchange, but may be provided by market makers, and so prices may not be accurate and may differ from the actual price at any given market, meaning prices are indicative and not appropriate for trading purposes. Fusion Media and any provider of the data contained in this website will not accept liability for any loss or damage as a result of your trading, or your reliance on the information contained within this website.
It is prohibited to use, store, reproduce, display, modify, transmit or distribute the data contained in this website without the explicit prior written permission of Fusion Media and/or the data provider. All intellectual property rights are reserved by the providers and/or the exchange providing the data contained in this website.
Fusion Media may be compensated by the advertisers that appear on the website, based on your interaction with the advertisements or advertisers.
© 2007-2024 - Fusion Media Limited. All Rights Reserved.