Trading is a never ending learning experience and it's supposed to be fun.
“When you have a purpose for every action, every action has a result.”
— Greg Plitt, Fitness Model & Motivational Speaker, 1977-2015
It's enjoyable when you recognize that it's a game of odds, and if you are purposeful in how you approach the stock market, you will seek out high probability trade set ups that are in your favor before you take on any position.
Do we make mistakes in trading? Of course we do - we all do. The point is to learn from those missteps and apply the lessons acquired to future opportunities as they arise in the market.
Identify your trading style and perfect it. Only you can determine what level of risk you're comfortable with taking on in any given trade, what types of set ups you have a preference for, and what your profit targets may be.
So with the idea of purposeful trading in mind, let's take a look at two stocks we've highlighted on the blog before, CF Industries . (NYSE:CF) and Netease (NASDAQ:NTES).

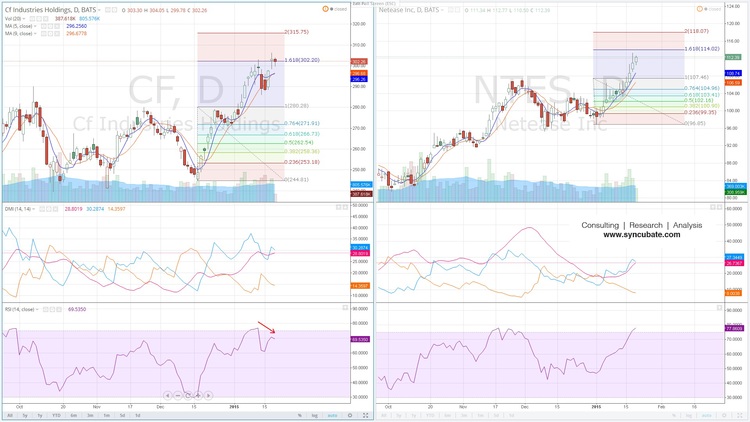
CF Industries Holdings Inc. and Netease Inc.
Both CF and NTES have been riding high, as +DMI is above -DMI on the daily time frame for both stocks, indicative of bullish strength. In the case of CF, the bulls really took control at the end of December, whereas with NTES, the bulls resurfaced in the beginning of January.
Both stocks are also trading near their 1.618 Fibonacci extension targets; keeping in mind that this is a rough estimate of breakout price potential over previous resistance levels, we can see that CF is currently trading at its 1.618 Fibonacci level of about $302, while NTES flirted with its 1.618 Fibonacci level around $114 on 1/20/15 when it hit a high of $113.41.
Of the two stocks, CF is displaying more weakness in my opinion because it has achieved new closing highs above $300 in recent days, yet we are seeing negative divergence in the RSI signal as it has recorded a lower peak then it had during the stock's initial breach of the $300 level on 1/12/15 and 1/13/15.
Additionally, CF's 5 DMA just crossed below the stock's 9 DMA as of the close yesterday. The 5 DMA is at $296.25 whereas the 9 DMA is at $296.67. This is significant in that this is the first such occurrence since 12/19/14 in which the shorter term moving average closed below the intermediate term moving average; if this continues, caution is warranted for the bulls.
Considering CF traded as low as $286 last week (a support level I suggested to look out for on any pullback) and as high as $306.40 this week, another round of selling pressure by the bears is not out of the question.
NTES is also ripe for a retrace to its 5 DMA, given that it has had an uninterrupted run higher for the past twelve trading sessions. However, the 5 DMA is still above the 9 DMA for NTES, and this speaks to the underlying bullish momentum in the stock, so sell offs in the near term may be brief.
