
Dividend Aristocrats are stocks with a very long history--more than 25 years in a row--of uninterrupted dividend growth. Dividend Aristocrats normally have a lower volatility than other stocks. This could also be a disadvantage because you give up performance in a strong up-moving market. The solution is simple: Look for high beta stocks in this category. They can give you a better return when the market is very bullish.
I filtered all 54 stocks on the current Dividend Aristocrats list by highest rate of beta, starting with a value above one. Only 16 are more volatile than the overall market.
Air Products & Chemicals (APD) has a market capitalization of $22.40 billion. The company employs 20,900 people, generates revenue of $9.611 billion and has a net income of $1.025 billion. Air Products & Chemicals’s earnings before interest, taxes, depreciation and amortization (EBITDA) amounts to $2.359 billion. The EBITDA margin is 24.55 percent (the operating margin is 13.34 percent and the net profit margin 10.67 percent).
Financial Analysis: The total debt represents 31.39 percent of Air Products & Chemicals’s assets and the total debt in relation to the equity amounts to 82.11 percent. Due to the financial situation, a return on equity of 16.28 percent was realized by Air Products & Chemicals. Twelve trailing months earnings per share reached a value of $4.67. Last fiscal year, Air Products & Chemicals paid $2.50 in the form of dividends to shareholders.
Market Valuation: Here are the price ratios of the company: The P/E ratio is 22.89, the P/S ratio is 2.33 and the P/B ratio is finally 3.51. The dividend yield amounts to 2.66 percent and the beta ratio has a value of 1.24.
Walgreen (WAG) has a market capitalization of $47.48 billion. The company employs 171,000 people, generates revenue of $71.633 billion and has a net income of $2.127 billion. Walgreen’s earnings before interest, taxes, depreciation and amortization (EBITDA) amounts to $4.672 billion. The EBITDA margin is 6.52 percent (the operating margin is 4.84 percent and the net profit margin 2.97 percent).
Financial Analysis: The total debt represents 16.11 percent of Walgreen’s assets and the total debt in relation to the equity amounts to 29.57 percent. Due to the financial situation, a return on equity of 12.86 percent was realized by Walgreen. Twelve trailing months earnings per share reached a value of $2.27. Last fiscal year, Walgreen paid $0.95 in the form of dividends to shareholders.
Market Valuation: Here are the price ratios of the company: The P/E ratio is 22.11, the P/S ratio is 0.66 and the P/B ratio is finally 2.60. The dividend yield amounts to 2.51 percent and the beta ratio has a value of 1.10.
Illinois Tool Works (ITW) has a market capitalization of $33.09 billion. The company employs 60,000 people, generates revenue of $17.924 billion and has a net income of $2.495 billion. Illinois Tool Works’s earnings before interest, taxes, depreciation and amortization (EBITDA) amounts to $3.462 billion. The EBITDA margin is 19.31 percent (the operating margin is 15.88 percent and the net profit margin 13.92 percent).
Financial Analysis: The total debt represents 26.14 percent of Illinois Tool Works’s assets and the total debt in relation to the equity amounts to 47.80 percent. Due to the financial situation, a return on equity of 24.25 percent was realized by Illinois Tool Works. Twelve trailing months earnings per share reached a value of $5.26. Last fiscal year, Illinois Tool Works paid $1.48 in the form of dividends to shareholders.
Market Valuation: Here are the price ratios of the company: The P/E ratio is 13.97, the P/S ratio is 1.84 and the P/B ratio is finally 3.17. The dividend yield amounts to 2.29 percent and the beta ratio has a value of 1.14.
Dover (DOV) has a market capitalization of $14.82 billion. The company employs 35,000 people, generates revenue of $8.104 billion and has a net income of $833.12 million. Dover’s earnings before interest, taxes, depreciation and amortization (EBITDA) amounts to $1.798 billion. The EBITDA margin is 22.19 percent (the operating margin is 15.61 percent and the net profit margin 10.28 percent).
Financial Analysis: The total debt represents 26.81 percent of Dover’s assets and the total debt in relation to the equity amounts to 56.92 percent. Due to the financial situation, a return on equity of 16.92 percent was realized by Dover. Twelve trailing months earnings per share reached a value of $5.32. Last fiscal year, Dover paid $1.33 in the form of dividends to shareholders.
Market Valuation: Here are the price ratios of the company: The P/E ratio is 16.27, the P/S ratio is 1.82 and the P/B ratio is finally 3.08. The dividend yield amounts to 1.73 percent and the beta ratio has a value of 1.36.
Take a closer look at the full list of Dividend Aristocrats with high beta ratios. The average P/E ratio amounts to 21.12 and forward P/E ratio is 15.83. The dividend yield has a value of 2.33 percent. Price to book ratio is 3.74 and price to sales ratio 2.54. The operating margin amounts to 20.05 percent and the beta ratio is 1.29. Stocks from the list have an average debt to equity ratio of 0.54.
Here is the full table with some fundamentals (TTM): 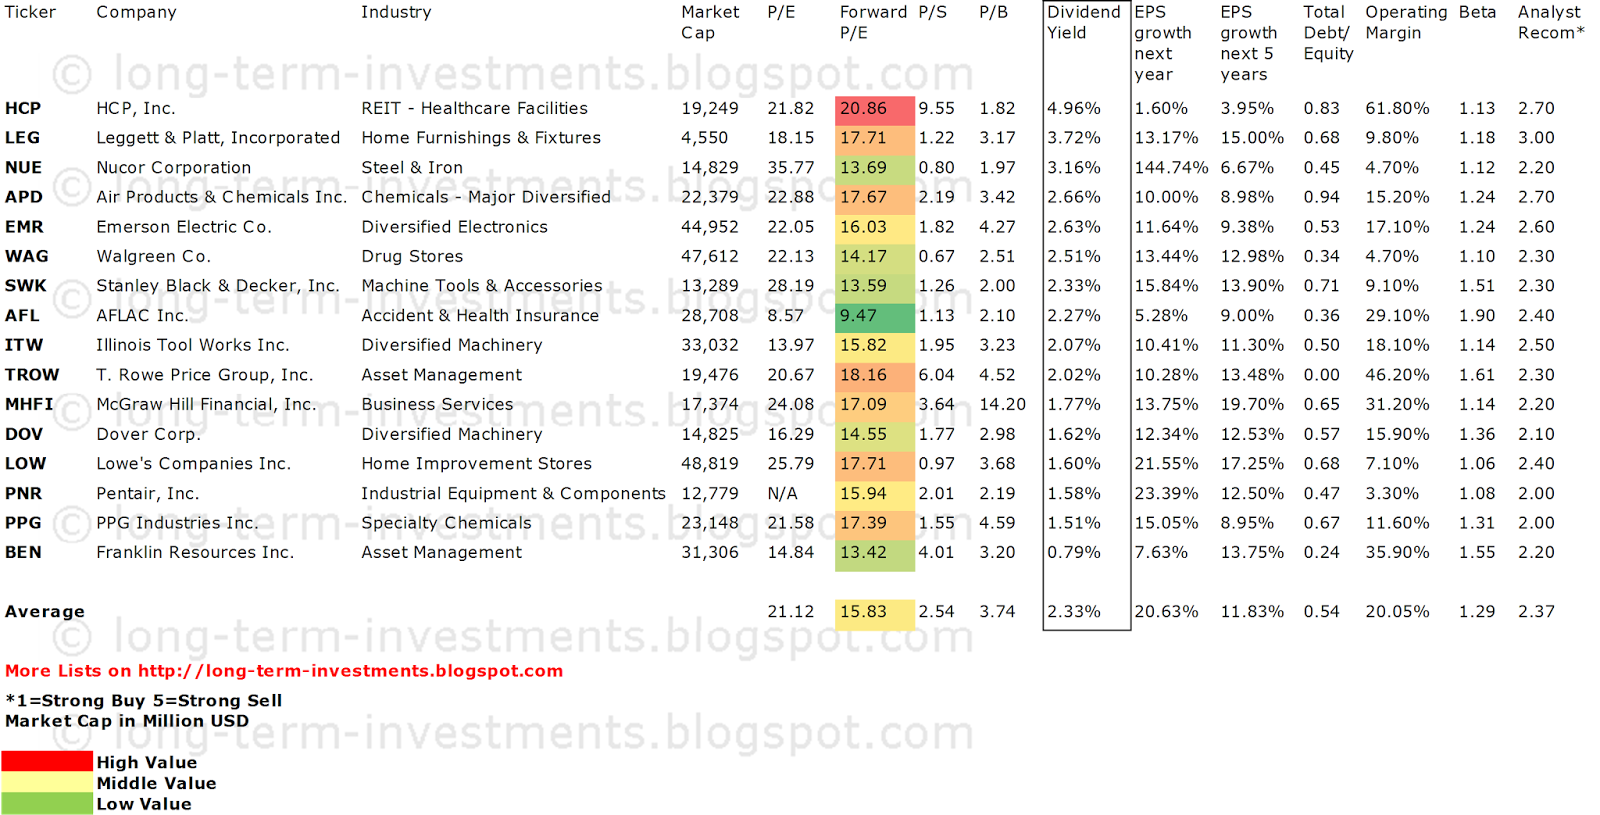
Related Stock Ticker Symbols: HCP, LEG, NUE, APD, EMR, WAG, SWK, AFL, ITW, TROW, MHFI, DOV, LOW, PNR, PPG, BEN -
Disclosure: I am long WAG, ITW. I receive no compensation to write about these specific stocks, sector or theme. I don't plan to increase or decrease positions or obligations within the next 72 hours.
For the other stocks: I have no positions in any stocks mentioned, and no plans to initiate any positions within the next 72 hours. I receive no compensation to write about any specific stock, sector or theme.
- English (UK)
- English (India)
- English (Canada)
- English (Australia)
- English (South Africa)
- English (Philippines)
- English (Nigeria)
- Deutsch
- Español (España)
- Español (México)
- Français
- Italiano
- Nederlands
- Português (Portugal)
- Polski
- Português (Brasil)
- Русский
- Türkçe
- العربية
- Ελληνικά
- Svenska
- Suomi
- עברית
- 日本語
- 한국어
- 简体中文
- 繁體中文
- Bahasa Indonesia
- Bahasa Melayu
- ไทย
- Tiếng Việt
- हिंदी
16 High Beta Dividend Aristocrats
Published 08/07/2013, 03:58 AM
Updated 07/09/2023, 06:31 AM
16 High Beta Dividend Aristocrats
Latest comments
Loading next article…
Install Our App
Risk Disclosure: Trading in financial instruments and/or cryptocurrencies involves high risks including the risk of losing some, or all, of your investment amount, and may not be suitable for all investors. Prices of cryptocurrencies are extremely volatile and may be affected by external factors such as financial, regulatory or political events. Trading on margin increases the financial risks.
Before deciding to trade in financial instrument or cryptocurrencies you should be fully informed of the risks and costs associated with trading the financial markets, carefully consider your investment objectives, level of experience, and risk appetite, and seek professional advice where needed.
Fusion Media would like to remind you that the data contained in this website is not necessarily real-time nor accurate. The data and prices on the website are not necessarily provided by any market or exchange, but may be provided by market makers, and so prices may not be accurate and may differ from the actual price at any given market, meaning prices are indicative and not appropriate for trading purposes. Fusion Media and any provider of the data contained in this website will not accept liability for any loss or damage as a result of your trading, or your reliance on the information contained within this website.
It is prohibited to use, store, reproduce, display, modify, transmit or distribute the data contained in this website without the explicit prior written permission of Fusion Media and/or the data provider. All intellectual property rights are reserved by the providers and/or the exchange providing the data contained in this website.
Fusion Media may be compensated by the advertisers that appear on the website, based on your interaction with the advertisements or advertisers.
© 2007-2024 - Fusion Media Limited. All Rights Reserved.