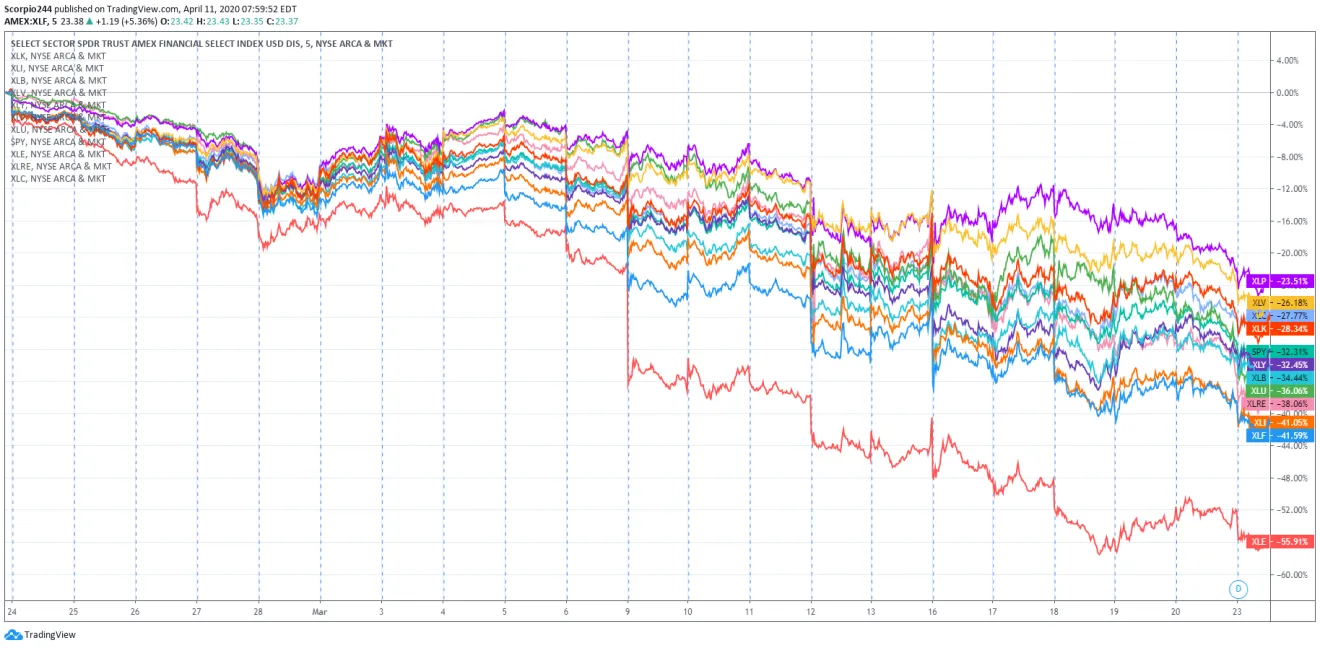
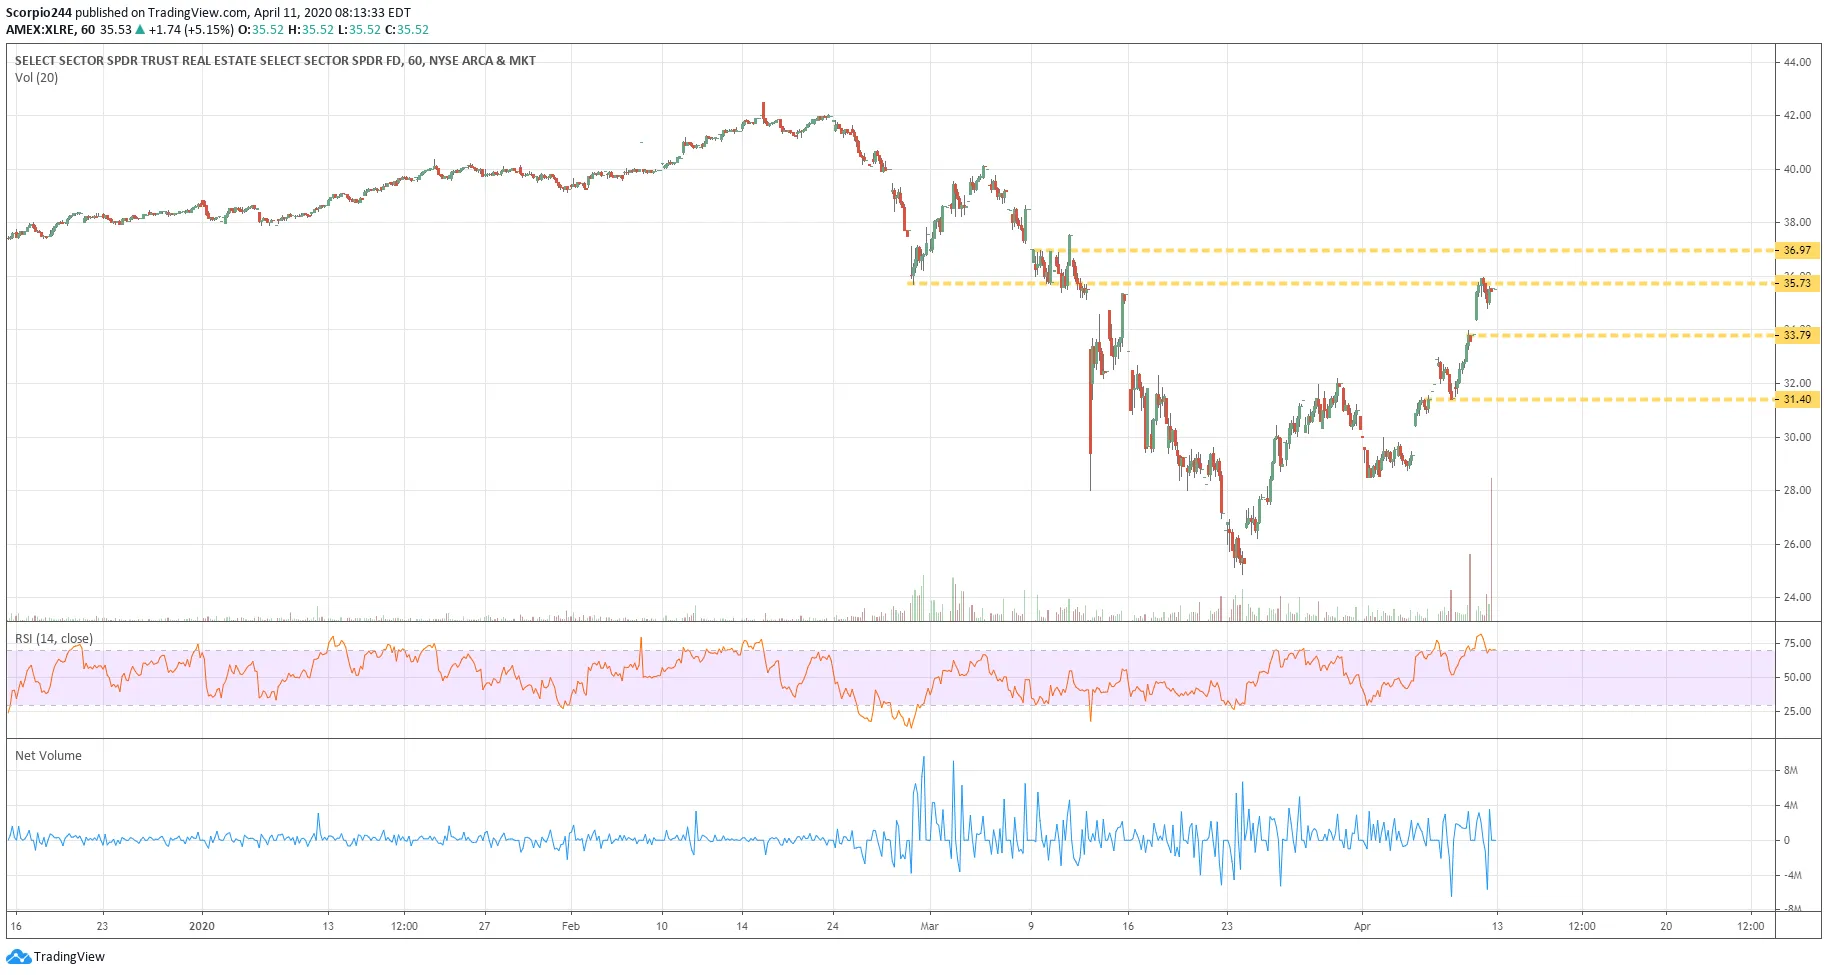
I think it may be essential to realize that those that sectors that led us up this week were the sectors that led us lower on the way down. From January 21 through March 23, the XLE was the worst-performing sector, dropping a stunning 55.9%. That was followed by the XLF, which fell by 41.6%, the XLI, which dropped by 41.1%, and the XLRE falling 38.1%.
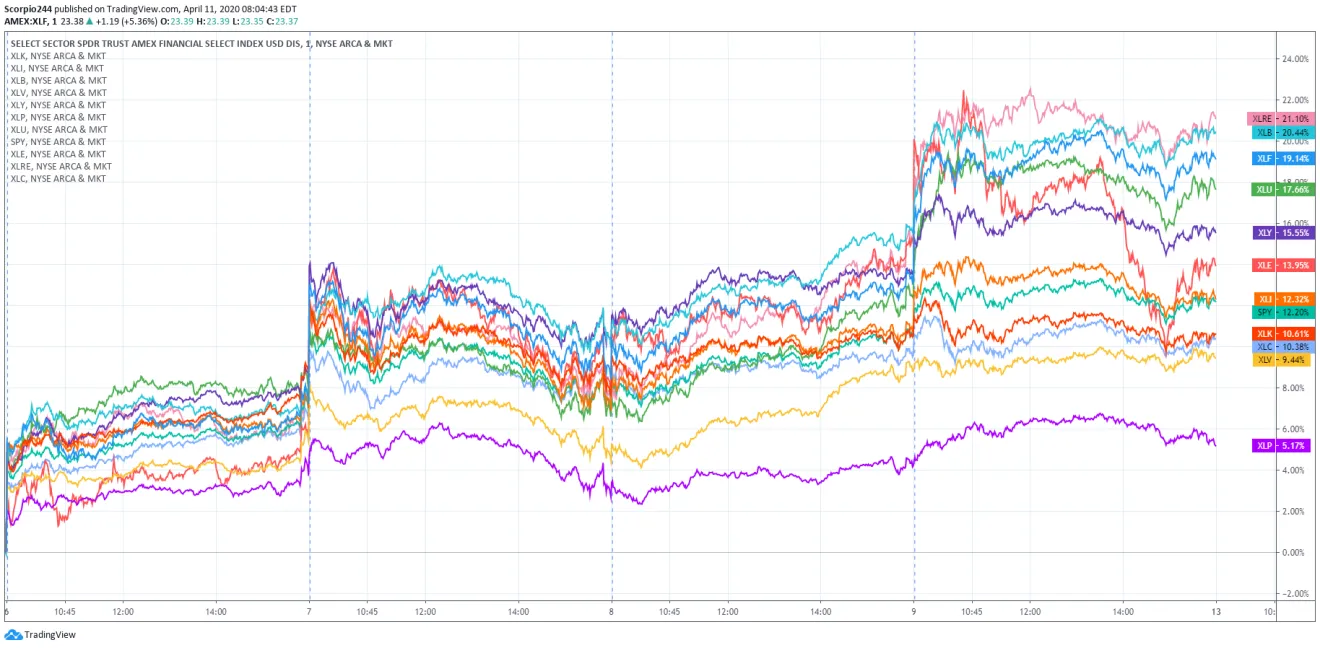
This week alone, the XLRE rose by 21.1%, the XLB jumped by 20.5%, the XLF increased by 19.1%, and the XLU followed by 17.6%. This matters a great deal.
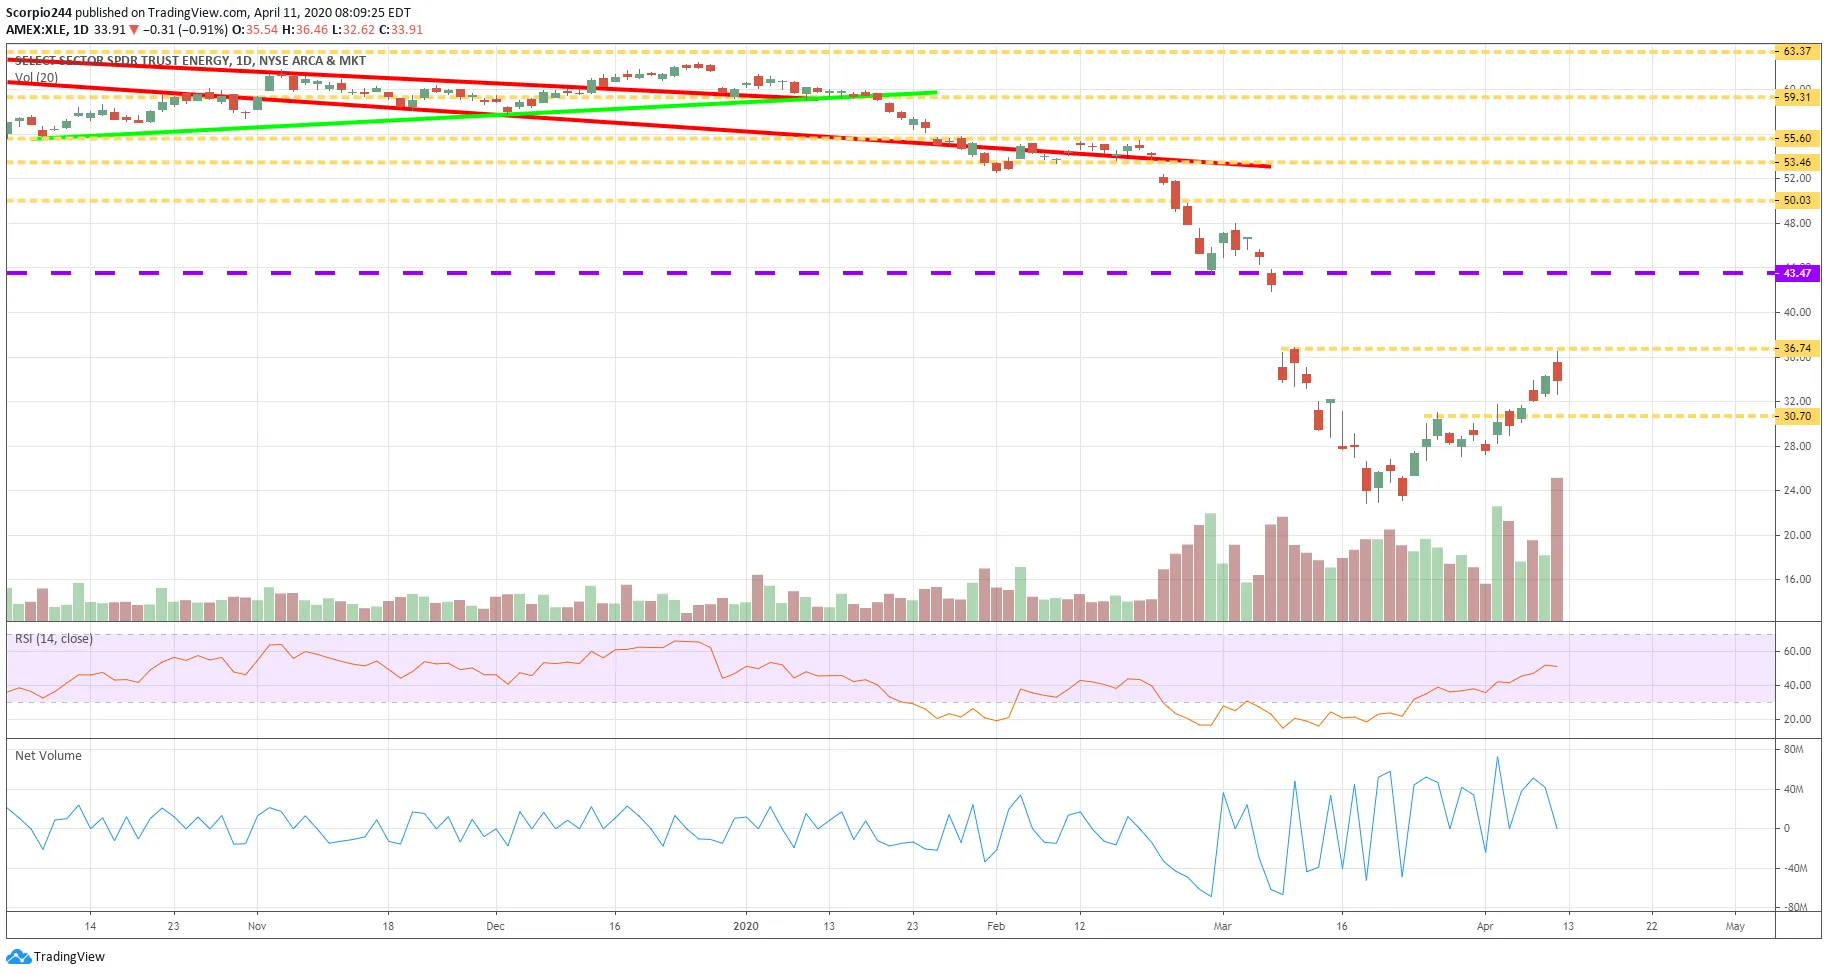
The XLE hit a resistance level at $36.75 on Friday and failed. Now, if it can break above that level of resistance at $36.75, then perhaps it fills the gap up to $43.50. However, if it doesn’t, it could fall to around $30.70.
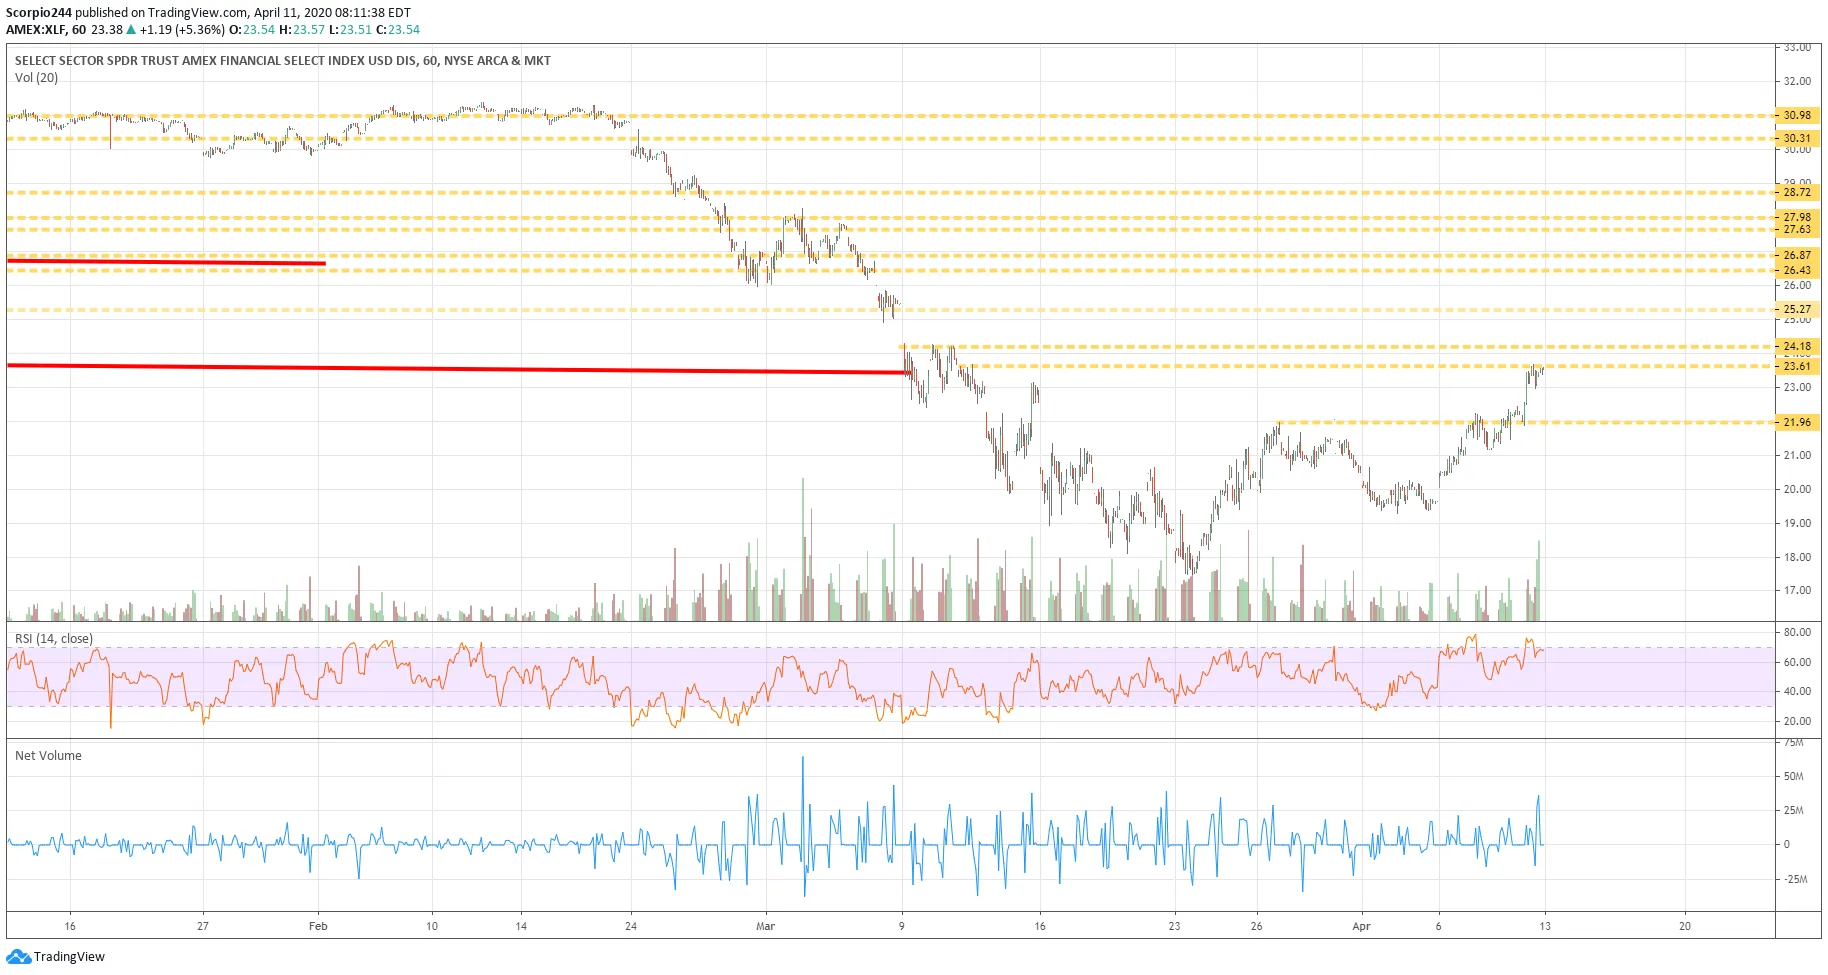
The XLF is also approaching a critical region of resistance at $23.60 to $24.20. It means that the XLF could also be ready to turn lower towards $22. Of course, there is the potential for a gap fill up to $25.30, and then a turn lower.
The XLRE also hit a level of resistance at $35.70 and could be poised to fall to around $33.80 to $31.40.
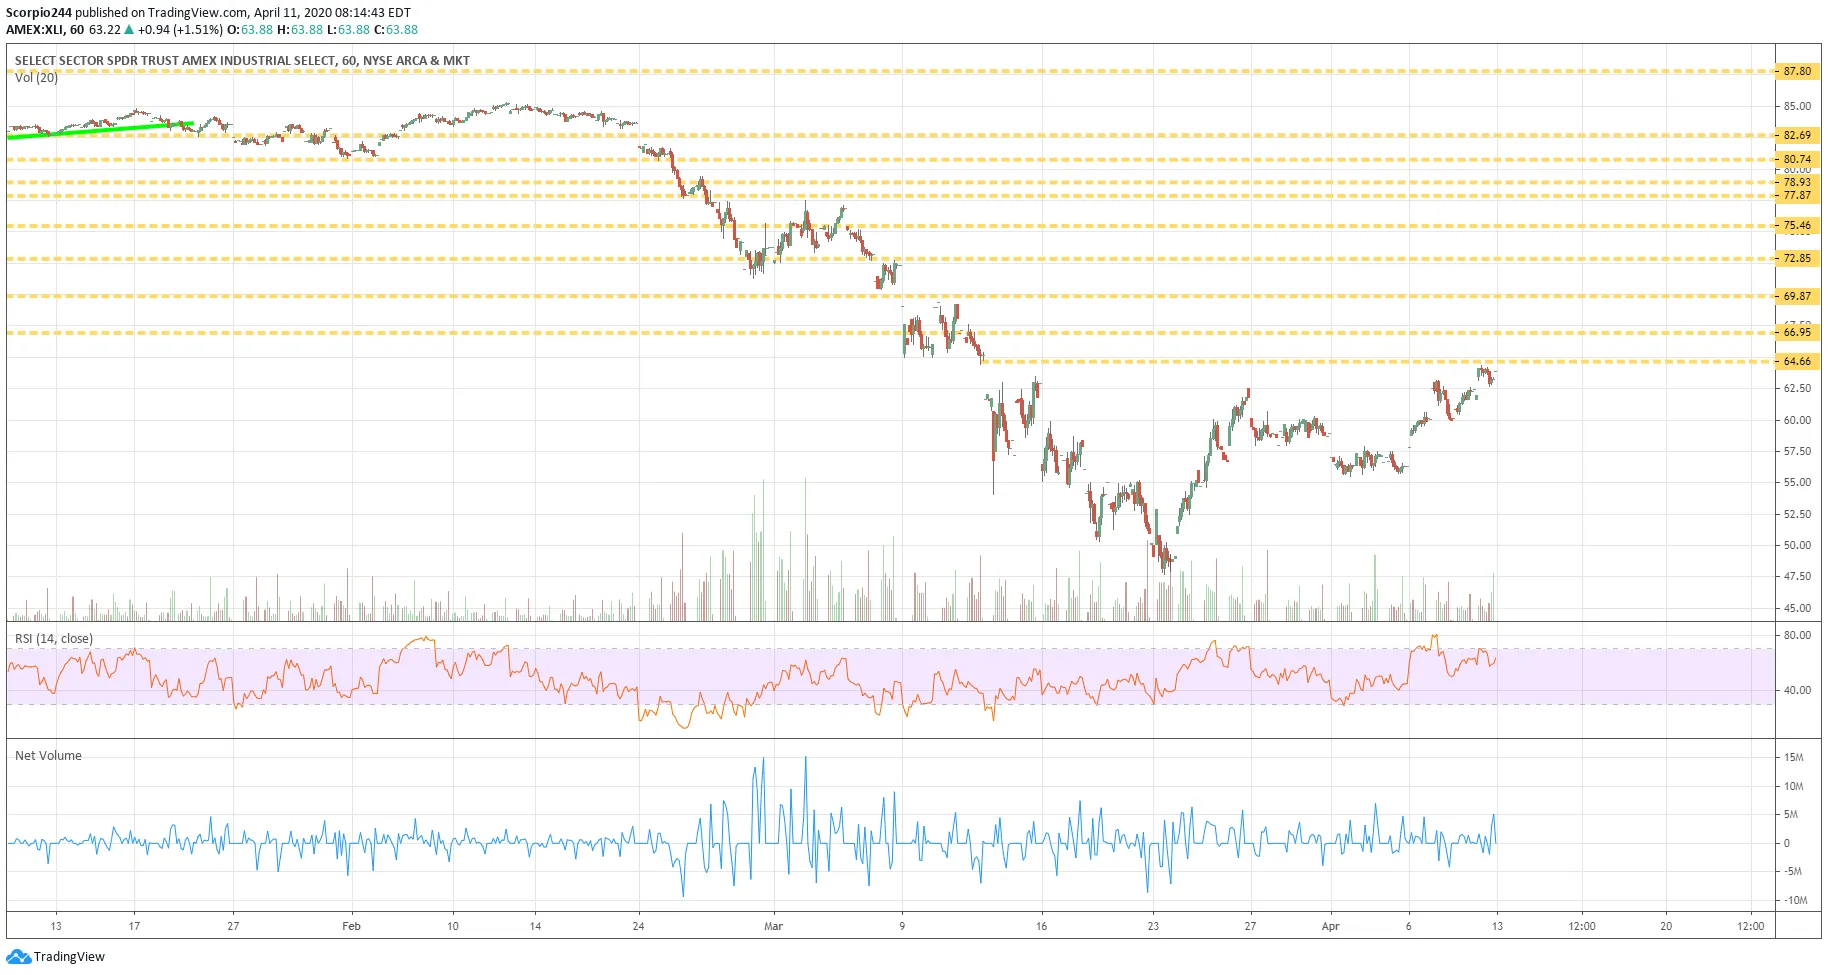
The XLI also filled a gap and hit resistance and failed last Friday at $64.65.
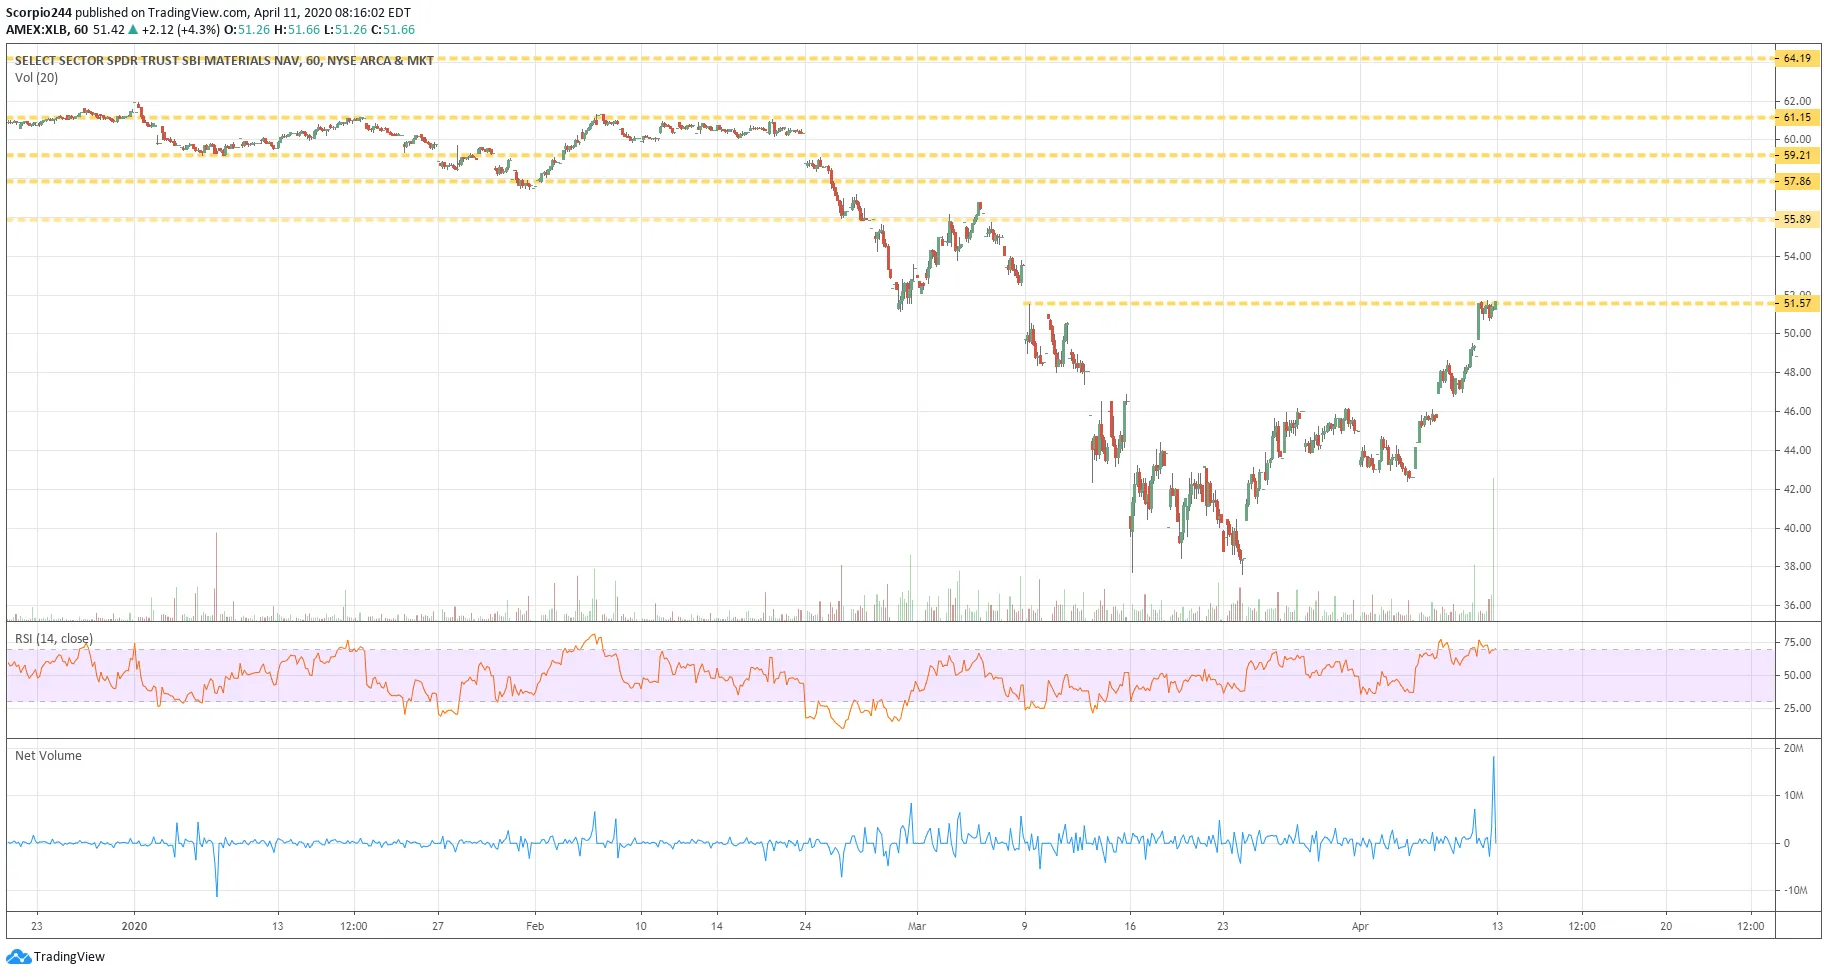
The XLB also hit resistance at $51.60, and failed, are you noticing a pattern here yet?
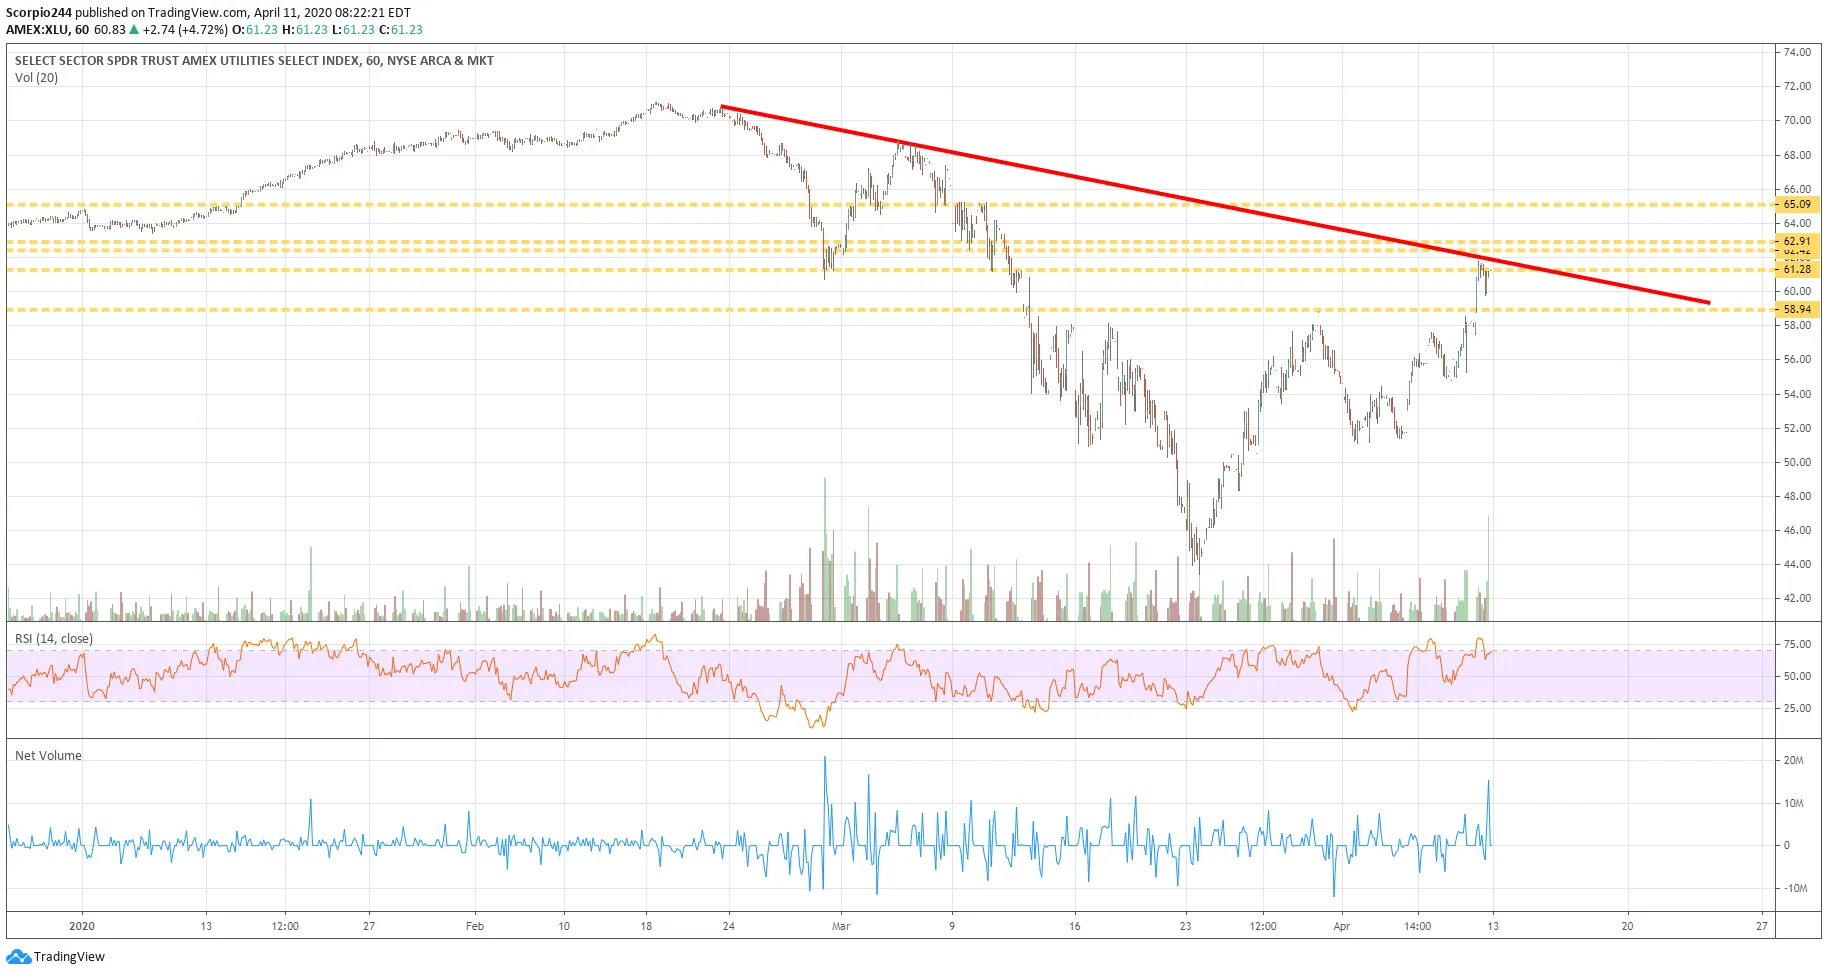
The XLU not only hit resistance but also hit a downtrend.
But the problem is that if you are looking only at the SPY, you aren’t going to see these sub-sector patterns.
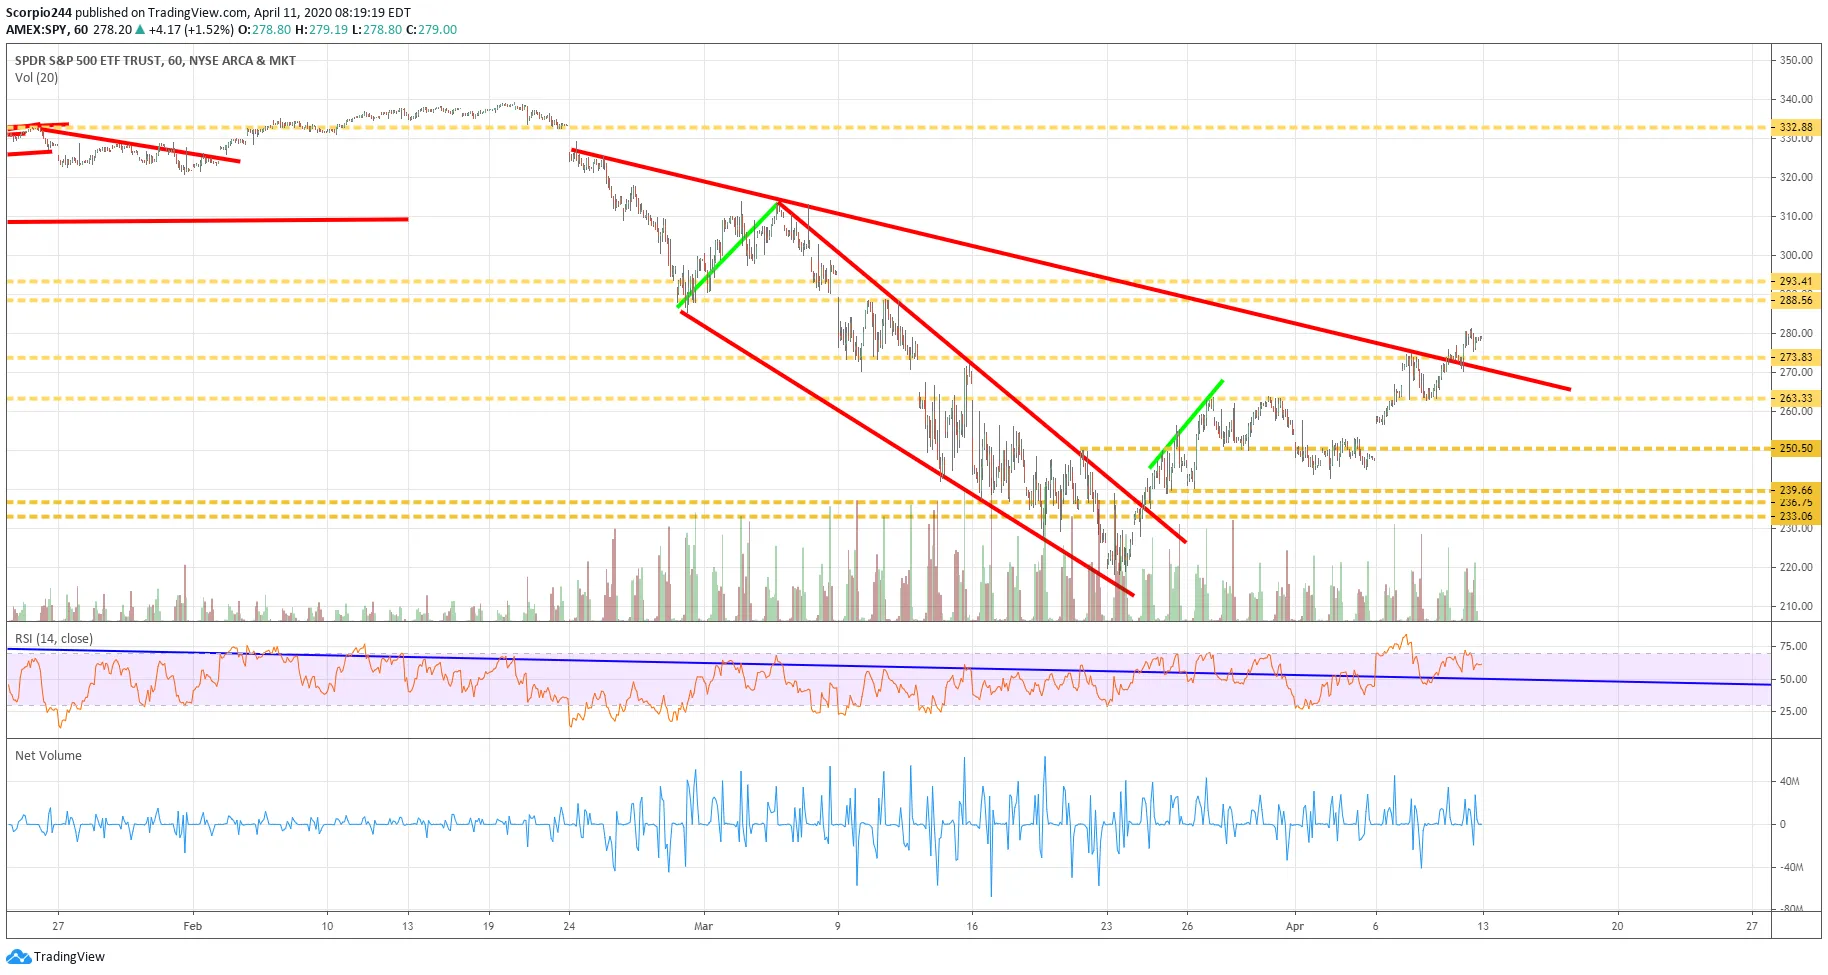
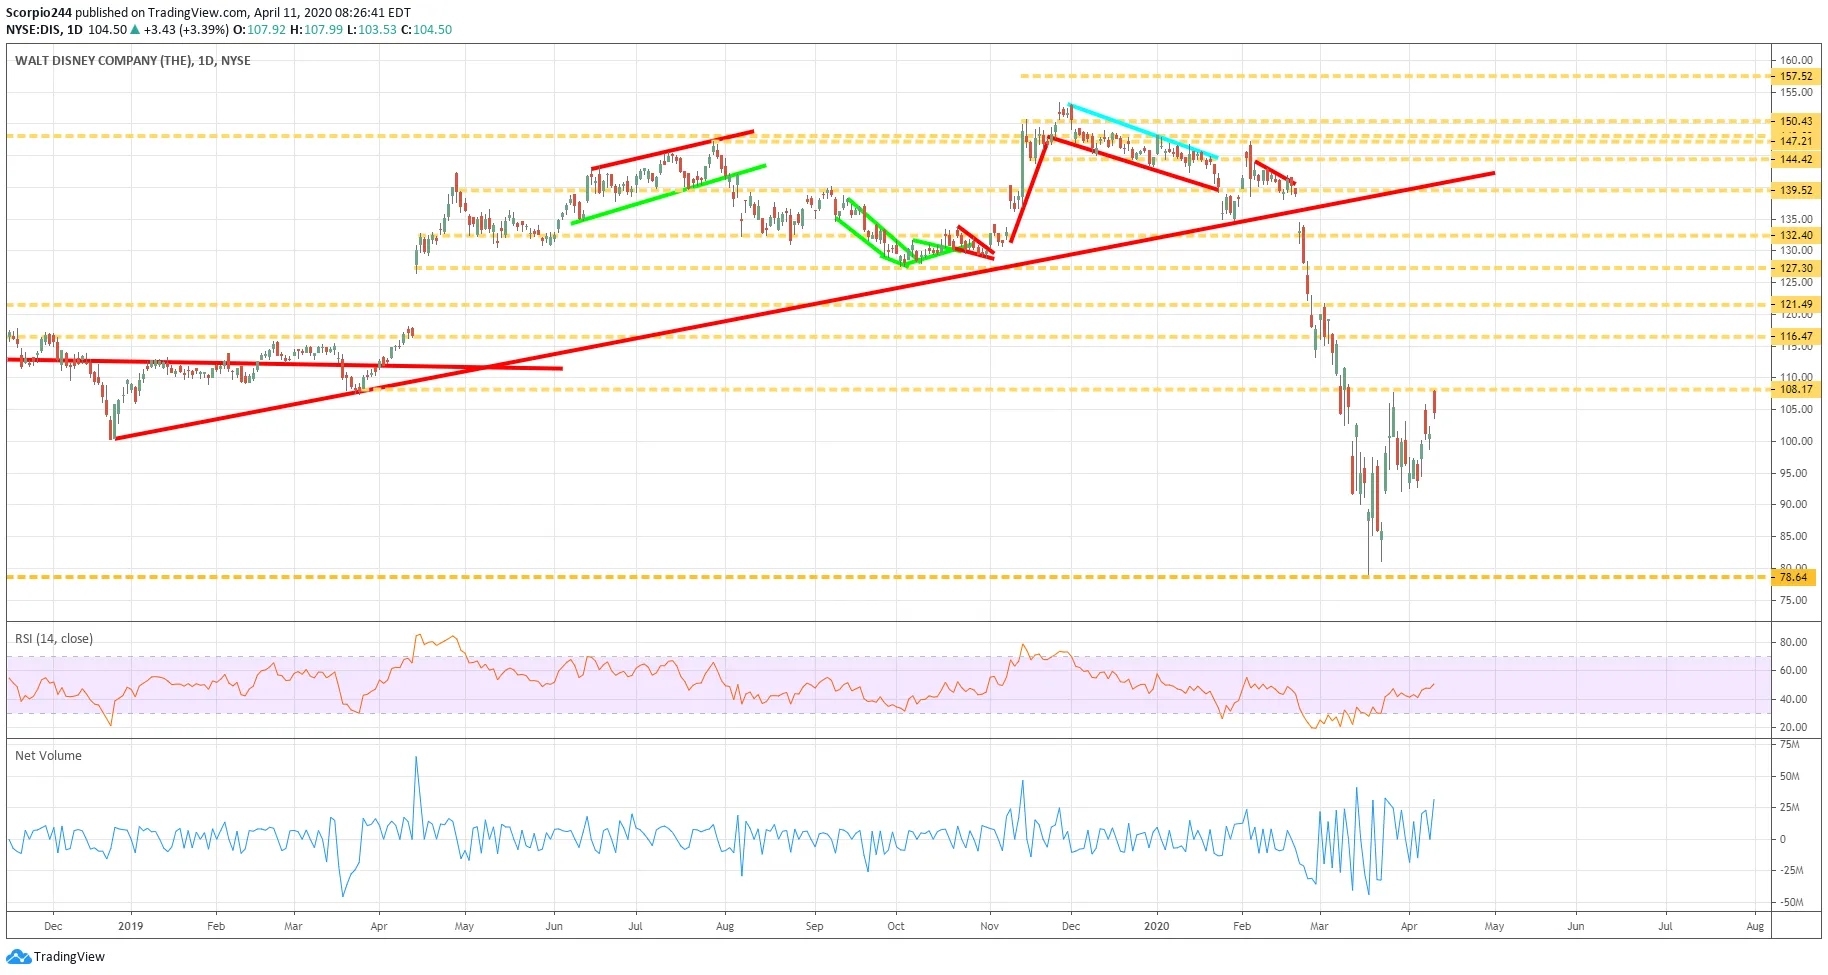
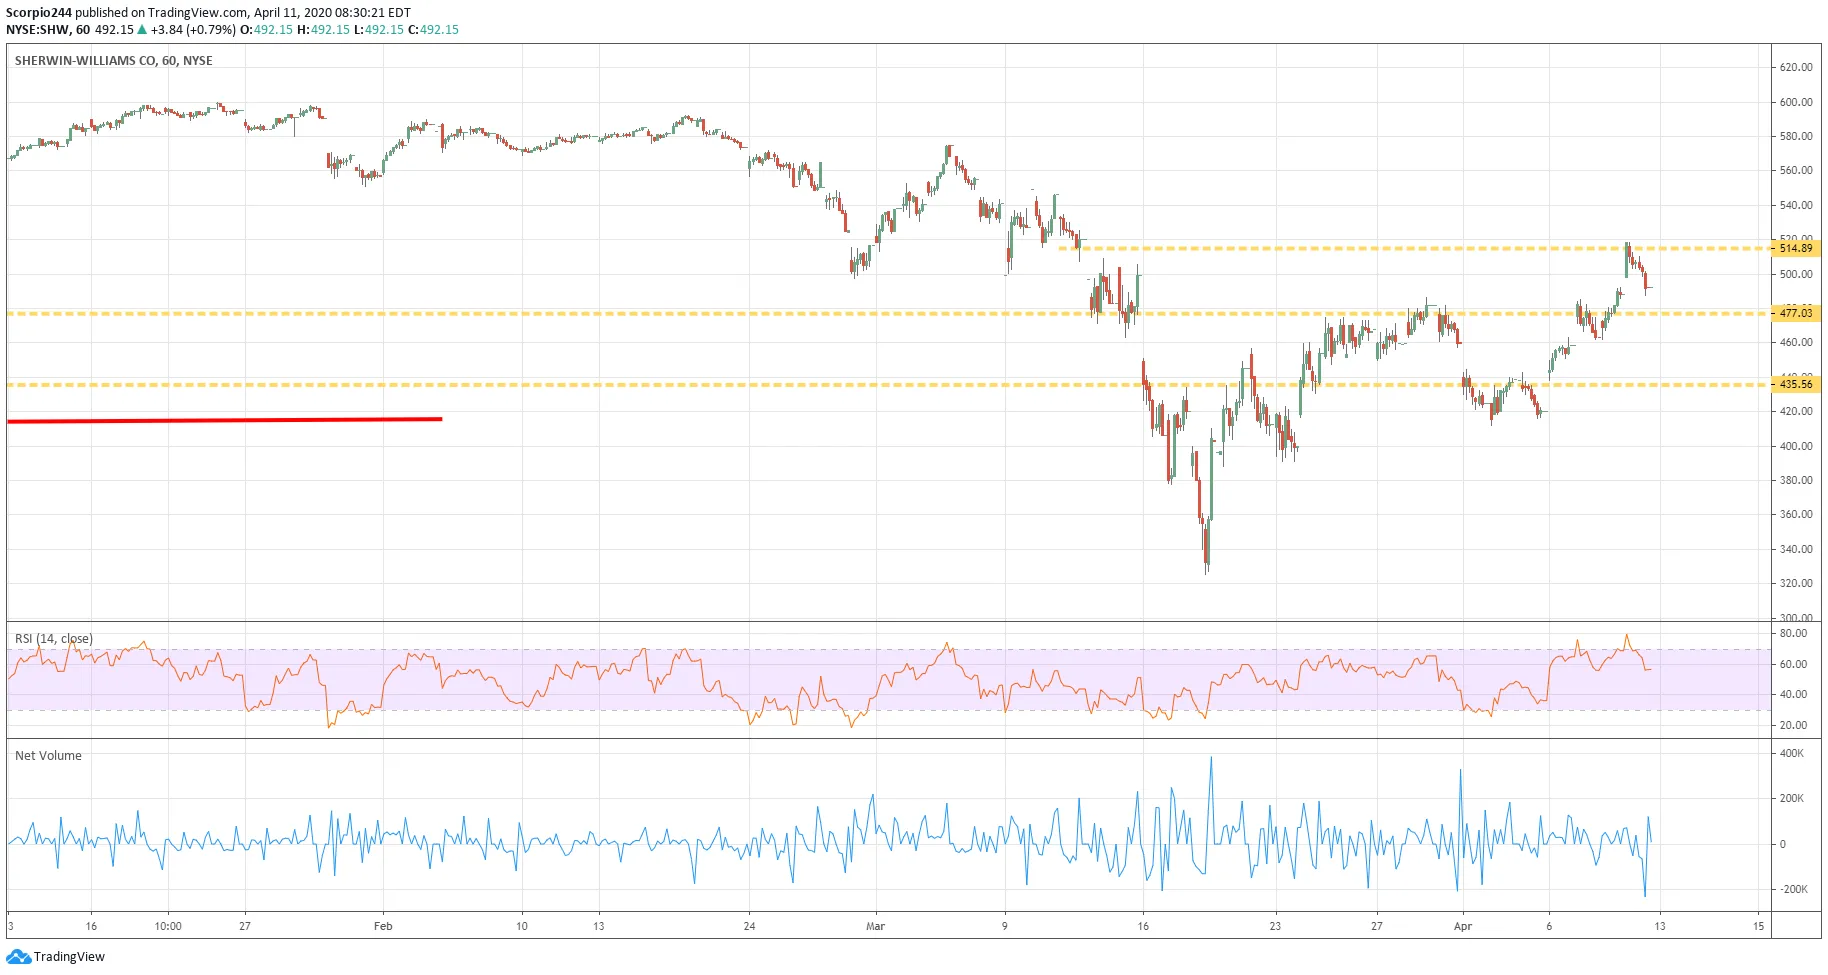
But it runs deeper.
JPMorgan (NYSE:JPM)- same.
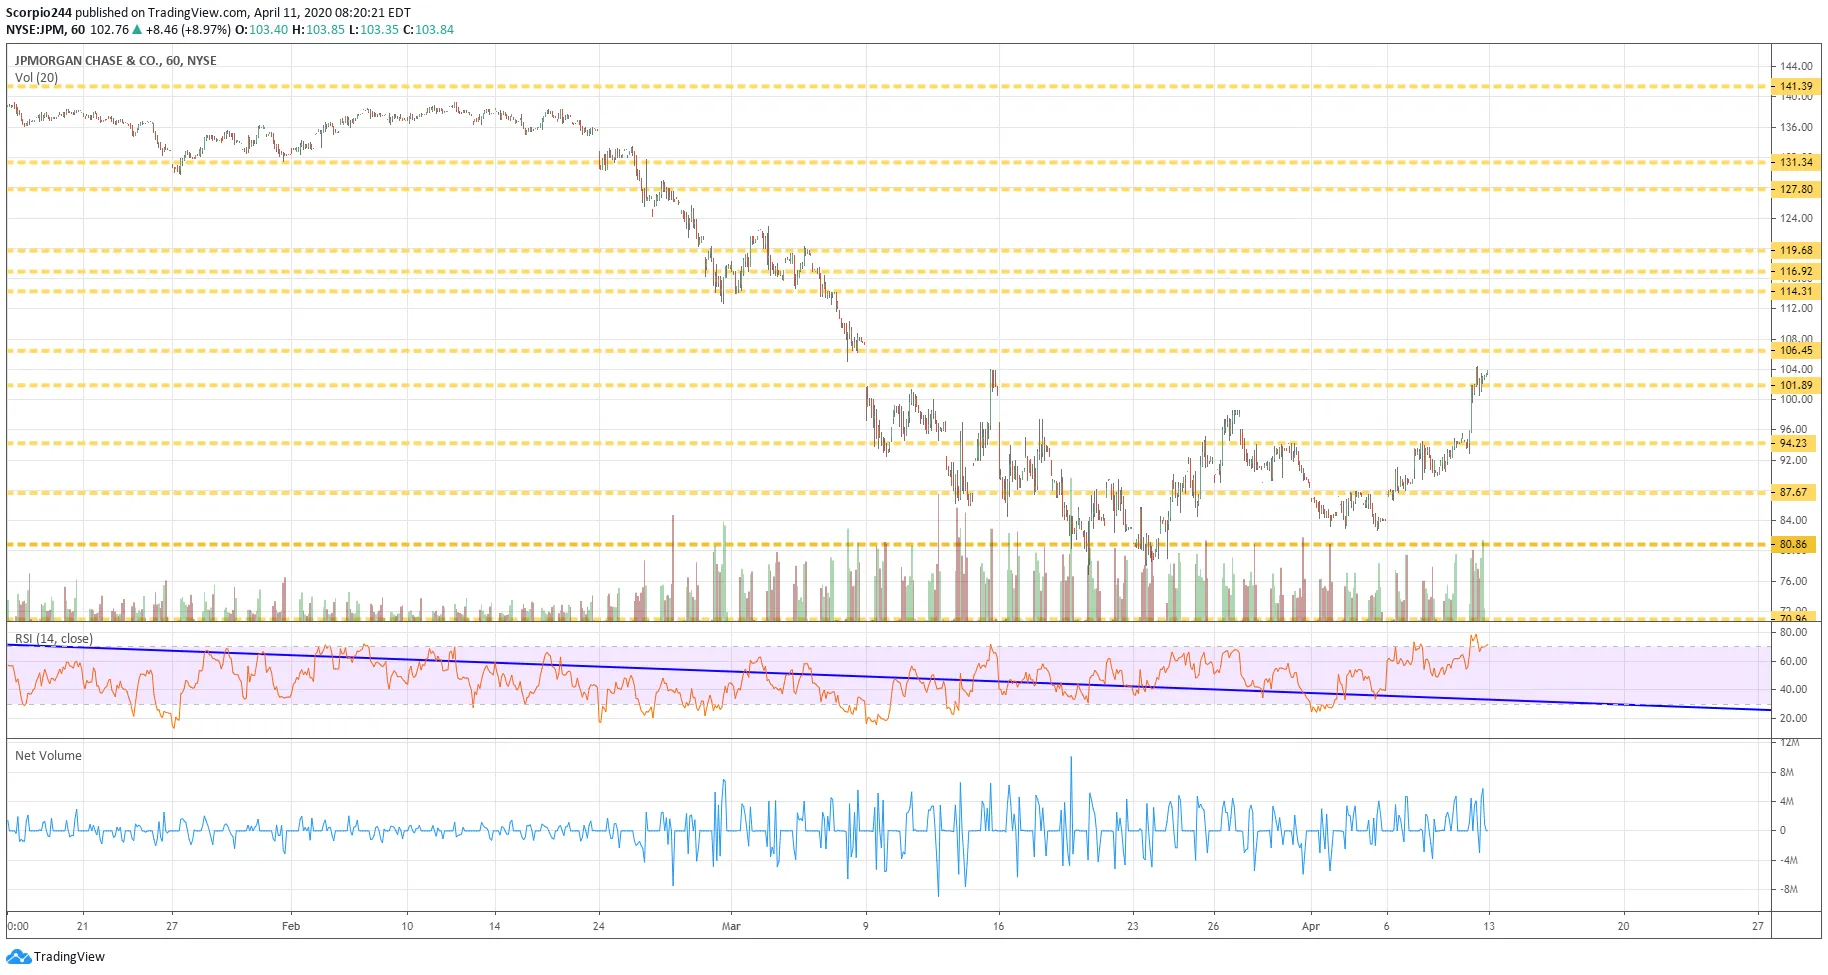
Exxon Mobil (NYSE:XOM) the same thing too
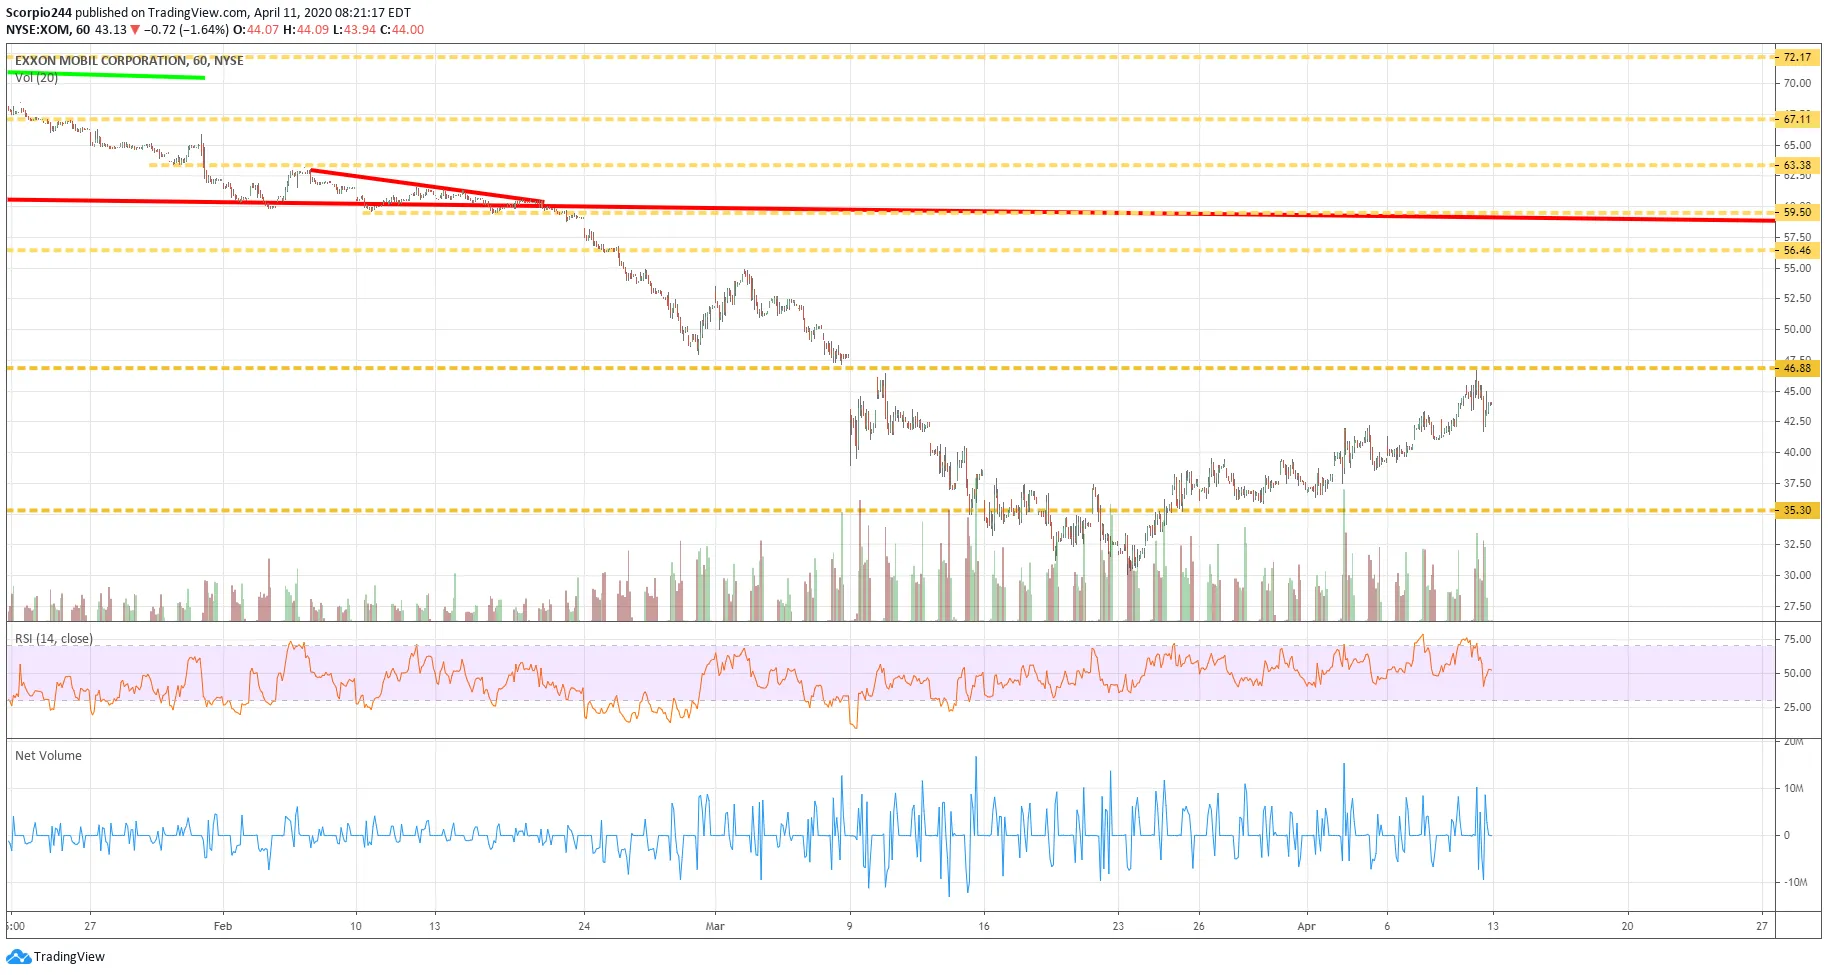
Honeywell (NYSE:HON)
Walt Disney Company (NYSE:DIS)
Sherwin-Williams (NYSE:SHW)
Home Depot (NYSE:HD)
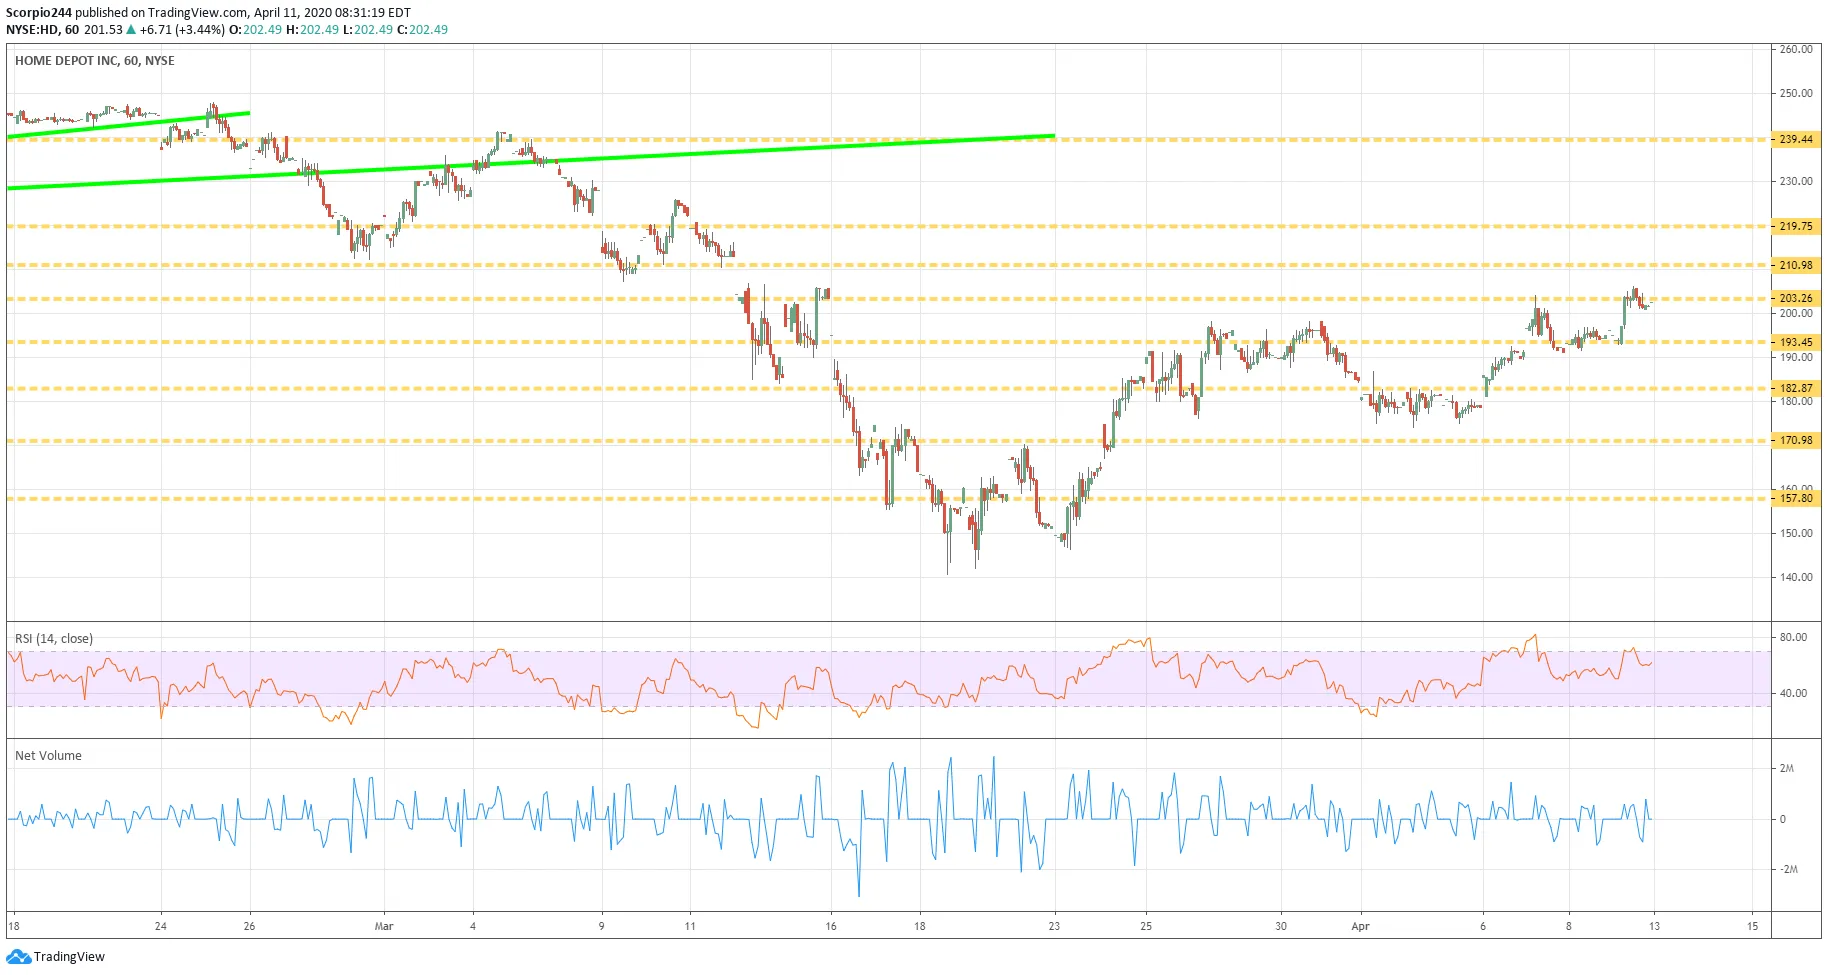
Notice Anything?
I think you get the point. So a reversion to the mean, don’t fight the Fed, relief checks galore, I think it seems pretty obvious that everything was doing the same thing last week, and these had been the hardest-hit sectors. So can it continue a little bit more, sure? But remember the banks report this week starting Tuesday, and while the market likely already discounted their earnings and revenue, what it hasn’t discounted is their commentary.
Earnings
I have been saying every company is likely to pull guidance for 2020 for weeks now. But remember what happened at the beginning of February, when Apple (NASDAQ:AAPL) pulled its guidance, the market rallied for a week, and then the shit hit the fan. Don’t be surprised if the same thing happens again.
Return To The Basics
Technical and fundamentals ALWAYS matter; the rules of the game haven’t changed. They may change for a day or week, but everything returns to the basic, Fed, or no Fed. The Fed may create a more favorable backdrop, but that’s about it.
Japan
If you want to see how much influence a central bank can have on its stock market, look at the Nikkei. The BOJ has been THE most aggressive CB on the planet, and that Index is still 50% off its all-time highs, and they ALREADY BUY EQUITY ETFs.
You know why their economy still struggles because their population is shrinking, and they have a demand problem, not enough people to spur growth.
What happens when people can’t leave their homes or travel for months on end, no demand. Think about it. Temporary here in the US, sure, but the market isn’t thinking about the demand issue yet, and the stimulus floated so far won’t be enough to bridge the gap until the economy returns to normal.
A Big Gap
The US is a $20 trillion economy, 2 months of idle GDP is $3.2 trillion, three months of idle GDP is about a $5 trillion gap, 6 months $10 trillion.
