
This month, I've been producing a series of articles on high-beta, dividend-paying stocks.
Today I'm screening for high beta dividend stocks from the industrial sector which have a cheap forward P/E ratio. Only 15 stocks from the sector fulfilled these criteria of which 11 currently have a buy recommendation.
ABB (ABB) has a market capitalization of $51.60 billion. The company employs 146,100 people, generates revenue of $39.33 billion and has a net income of $2.808 billion. ABB’s earnings before interest, taxes, depreciation and amortization (EBITDA) amounts to $5.719 billion. The EBITDA margin is 14.54 percent (the operating margin is 10.32 percent and the net profit margin 7.14 percent).
Financial Analysis: The total debt represents 20.52 percent of ABB’s assets and the total debt in relation to the equity amounts to 59.57 percent. Due to the financial situation, a return on equity of 16.52 percent was realized by ABB. Twelve trailing months earnings per share reached a value of $1.22. Last fiscal year, ABB paid $0.74 in the form of dividends to shareholders. Forward P/E: 13.68.
Market Valuation: Here are the price ratios of the company: The P/E ratio is 18.44, the P/S ratio is 1.33 and the P/B ratio is finally 3.05. The dividend yield amounts to 3.20 percent and the beta ratio has a value of 1.45.
General Electric (GE) has a market capitalization of $246.96 billion. The company employs 305,000 people, generates revenue of $147.359 billion and has a net income of $14.902 billion. General Electric’s earnings before interest, taxes, depreciation and amortization (EBITDA) amounts to $29.339 billion. The EBITDA margin is 19.91 percent (the operating margin is 11.81 percent and the net profit margin 10.11 percent).
Financial Analysis: The total debt represents 60.42 percent of General Electric’s assets and the total debt in relation to the equity amounts to 336.56 percent. Due to the financial situation, a return on equity of 12.24 percent was realized by General Electric. Twelve trailing months earnings per share reached a value of $1.40. Last fiscal year, General Electric paid $0.70 in the form of dividends to shareholders. Forward P/E: 13.35.
Market Valuation: Here are the price ratios of the company: The P/E ratio is 17.28, the P/S ratio is 1.68 and the P/B ratio is finally 2.05. The dividend yield amounts to 3.13 percent and the beta ratio has a value of 1.68.
Caterpillar (CAT) has a market capitalization of $54.73 billion. The company employs 122,402 people, generates revenue of $65.875 billion and has a net income of $5.708 billion. Caterpillar’s earnings before interest, taxes, depreciation and amortization (EBITDA) amounts to $12.167 billion. The EBITDA margin is 18.47 percent (the operating margin is 13.01 percent and the net profit margin 8.66 percent).
Financial Analysis: The total debt represents 44.92 percent of Caterpillar’s assets and the total debt in relation to the equity amounts to 228.97 percent. Due to the financial situation, a return on equity of 37.36 percent was realized by Caterpillar. Twelve trailing months earnings per share reached a value of $6.34. Last fiscal year, Caterpillar paid $2.02 in the form of dividends to shareholders. Forward P/E: 11.50.
Market Valuation: Here are the price ratios of the company: The P/E ratio is 13.33, the P/S ratio is 0.83 and the P/B ratio is finally 3.16. The dividend yield amounts to 2.84 percent and the beta ratio has a value of 1.90.
Take a closer look at the full list of cheap industrial high beta dividend stocks. The average P/E ratio amounts to 17.39 and forward P/E ratio is 13.05. The dividend yield has a value of 2.26 percent. Price to book ratio is 3.30 and price to sales ratio 1.22. The operating margin amounts to 11.05 percent and the beta ratio is 1.55. Stocks from the list have an average debt to equity ratio of 1.06.
Here is the full table with some fundamentals (TTM): 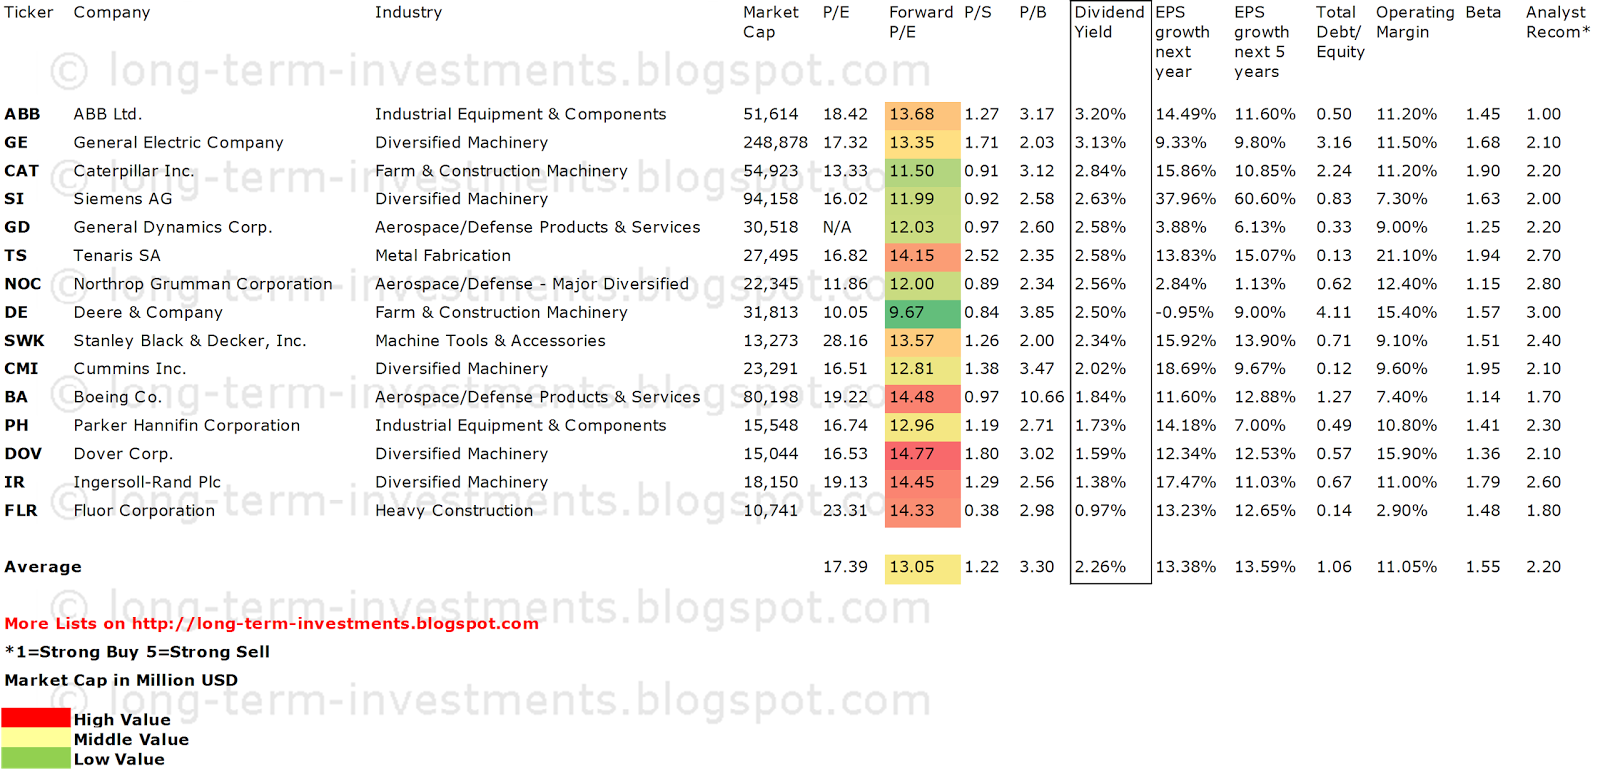
Related Stock Ticker Symbols:
ABB, GE, CAT, SI, GD, TS, NOC, DE, SWK, CMI, BA, PH, DOV, IR, FLR
Disclosure: I am long GE. I receive no compensation to write about these specific stocks, sector or theme. I don't plan to increase or decrease positions or obligations within the next 72 hours.
For the other stocks: I have no positions in any stocks mentioned, and no plans to initiate any positions within the next 72 hours. I receive no compensation to write about any specific stock, sector or theme.
- English (UK)
- English (India)
- English (Canada)
- English (Australia)
- English (South Africa)
- English (Philippines)
- English (Nigeria)
- Deutsch
- Español (España)
- Español (México)
- Français
- Italiano
- Nederlands
- Português (Portugal)
- Polski
- Português (Brasil)
- Русский
- Türkçe
- العربية
- Ελληνικά
- Svenska
- Suomi
- עברית
- 日本語
- 한국어
- 简体中文
- 繁體中文
- Bahasa Indonesia
- Bahasa Melayu
- ไทย
- Tiếng Việt
- हिंदी
15 Inexpensive, Dividend-Paying, High Beta Industrial Stocks
Published 08/12/2013, 03:47 AM
Updated 07/09/2023, 06:31 AM
15 Inexpensive, Dividend-Paying, High Beta Industrial Stocks
3rd party Ad. Not an offer or recommendation by Investing.com. See disclosure here or
remove ads
.
Latest comments
Install Our App
Risk Disclosure: Trading in financial instruments and/or cryptocurrencies involves high risks including the risk of losing some, or all, of your investment amount, and may not be suitable for all investors. Prices of cryptocurrencies are extremely volatile and may be affected by external factors such as financial, regulatory or political events. Trading on margin increases the financial risks.
Before deciding to trade in financial instrument or cryptocurrencies you should be fully informed of the risks and costs associated with trading the financial markets, carefully consider your investment objectives, level of experience, and risk appetite, and seek professional advice where needed.
Fusion Media would like to remind you that the data contained in this website is not necessarily real-time nor accurate. The data and prices on the website are not necessarily provided by any market or exchange, but may be provided by market makers, and so prices may not be accurate and may differ from the actual price at any given market, meaning prices are indicative and not appropriate for trading purposes. Fusion Media and any provider of the data contained in this website will not accept liability for any loss or damage as a result of your trading, or your reliance on the information contained within this website.
It is prohibited to use, store, reproduce, display, modify, transmit or distribute the data contained in this website without the explicit prior written permission of Fusion Media and/or the data provider. All intellectual property rights are reserved by the providers and/or the exchange providing the data contained in this website.
Fusion Media may be compensated by the advertisers that appear on the website, based on your interaction with the advertisements or advertisers.
© 2007-2024 - Fusion Media Limited. All Rights Reserved.