
Today, I'm screening for the following core criteria:
- Market Capitalization over USD 10 billion
- Debt-to-Equity Ratio below 0.5
- Beta Ratio Below one
In order to get the top yielding results with cheap expected P/E’s, I selected only those stocks with a forward P/E of less than 15 as well as a dividend yield of more than 3 percent. Only thirteen stocks fulfilled my safe haven characteristics of which two are High-Yields and seven are recommended to buy. Many telecoms are part of the results.
The sector is definitely low priced and there is a huge rumor about takeovers. I also have shares of AT&T and Rogers in my Dividend Yield Passive Income Portfolio.
Telefonica Brasil (VIV) has a market capitalization of $25.08 billion. The company employs 19,614 people, generates revenue of $15.201 billion and has a net income of $1.994 billion. Telefonica Brasil’s earnings before interest, taxes, depreciation and amortization (EBITDA) amounts to $5.198 billion. The EBITDA margin is 34.20 percent (the operating margin is 21.26 percent and the net profit margin 13.12 percent).
Financial Analysis: The total debt represents 11.39 percent of Telefonica Brasil’s assets and the total debt in relation to the equity amounts to 17.91 percent. Due to the financial situation, a return on equity of 10.12 percent was realized by Telefonica Brasil. Twelve trailing months earnings per share reached a value of $1.65. Last fiscal year, Telefonica Brasil paid $1.27 in the form of dividends to shareholders. Forward P/E: 12.88.
Market Valuation: Here are the price ratios of the company: The P/E ratio is 13.54, the P/S ratio is 1.61 and the P/B ratio is finally 1.27. The dividend yield amounts to 9.37 percent and the beta ratio has a value of 0.62.
Ecopetrol (EC) has a market capitalization of $94.96 billion. The company employs 8,087 people, generates revenue of $35.317 billion and has a net income of $7.863 billion. Ecopetrol’s earnings before interest, taxes, depreciation and amortization (EBITDA) amounts to $15.070 billion. The EBITDA margin is 42.67 percent (the operating margin is 35.23 percent and the net profit margin 22.26 percent).
Financial Analysis: The total debt represents 17.73 percent of Ecopetrol’s assets and the total debt in relation to the equity amounts to 38.40 percent. Due to the financial situation, a return on equity of 39.88 percent was realized by Ecopetrol. Twelve trailing months earnings per share reached a value of $3.46. Last fiscal year, Ecopetrol paid $3.17 in the form of dividends to shareholders. Forward P/E: 12.83.
Market Valuation: Here are the price ratios of the company: The P/E ratio is 13.36, the P/S ratio is 2.73 and the P/B ratio is finally 4.82. The dividend yield amounts to 5.90 percent and the beta ratio has a value of 0.94.
Total (TOT) has a market capitalization of $133.63 billion. The company employs 97,126 people, generates revenue of $246.559 billion and has a net income of $14.662 billion. Total’s earnings before interest, taxes, depreciation and amortization (EBITDA) amounts to $44.973 billion. The EBITDA margin is 18.24 percent (the operating margin is 12.29 percent and the net profit margin 5.95 percent).
Financial Analysis: The total debt represents 19.37 percent of Total’s assets and the total debt in relation to the equity amounts to 45.66 percent. Due to the financial situation, a return on equity of 15.17 percent was realized by Total. Twelve trailing months earnings per share reached a value of $5.65. Last fiscal year, Total paid $3.16 in the form of dividends to shareholders. Forward P/E: 8.35.
Market Valuation: Here are the price ratios of the company: The P/E ratio is 10.43, the P/S ratio is 0.56 and the P/B ratio is finally 1.33. The dividend yield amounts to 5.32 percent and the beta ratio has a value of 0.99.
Intel (INTC) has a market capitalization of $114.49 billion. The company employs 106,000 people, generates revenue of $53.341 billion and has a net income of $11.005 billion. Intel’s earnings before interest, taxes, depreciation and amortization (EBITDA) amounts to $22.160 billion. The EBITDA margin is 41.54 percent (the operating margin is 27.44 percent and the net profit margin 20.63 percent).
Financial Analysis: The total debt represents 15.94 percent of Intel’s assets and the total debt in relation to the equity amounts to 26.26 percent. Due to the financial situation, a return on equity of 22.66 percent was realized by Intel. Twelve trailing months earnings per share reached a value of $1.85. Last fiscal year, Intel paid $0.64 in the form of dividends to shareholders. Forward P/E: 11.65.
Market Valuation: Here are the price ratios of the company: The P/E ratio is 12.42, the P/S ratio is 2.21 and the P/B ratio is finally 2.29. The dividend yield amounts to 3.80 percent and the beta ratio has a value of 0.97.
Take a closer look at the full list of safe haven stocks with chap P/E's and adequade dividend yields. The average P/E ratio amounts to 14.29 and forward P/E ratio is 11.88. The dividend yield has a value of 3.96 percent. Price to book ratio is 2.33 and price to sales ratio 2.38. The operating margin amounts to 23.78 percent and the beta ratio is 0.78. Stocks from the list have an average debt to equity ratio of 0.24.
Here is the full table with some fundamentals (TTM): 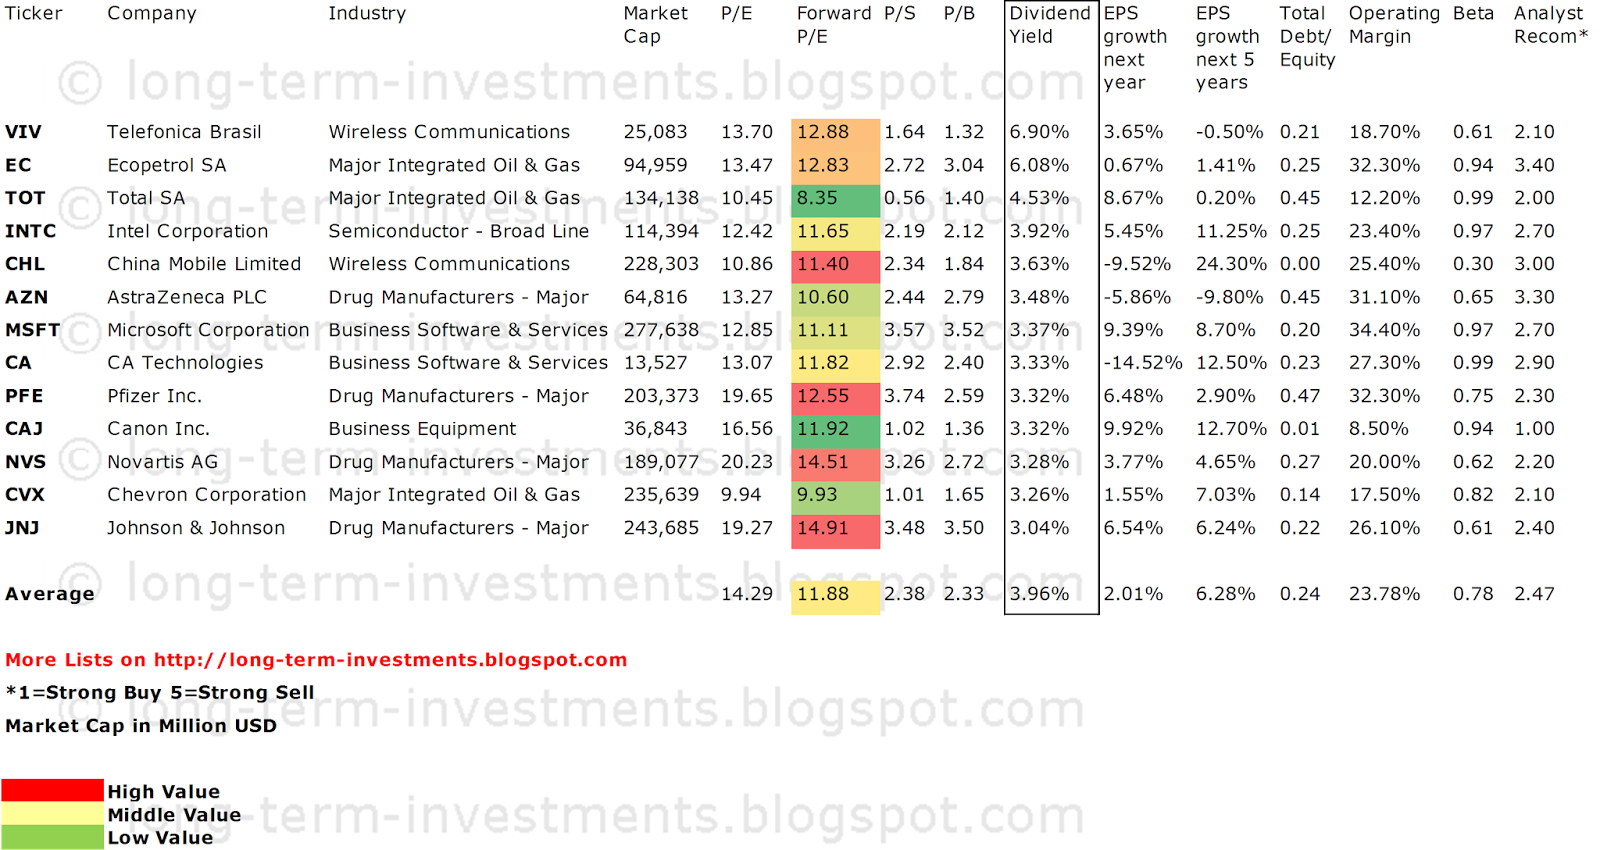
Related Stock Ticker Symbols:
VIV, EC, TOT, INTC, CHL, AZN, MSFT, CA, PFE, CAJ, NVS, CVX, JNJ
Disclosure: I am long CHL, AZN, CA, JNJ. I receive no compensation to write about these specific stocks, sector or theme. I don't plan to increase or decrease positions or obligations within the next 72 hours.
For the other stocks: I have no positions in any stocks mentioned, and no plans to initiate any positions within the next 72 hours. I receive no compensation to write about any specific stock, sector or theme.
- English (UK)
- English (India)
- English (Canada)
- English (Australia)
- English (South Africa)
- English (Philippines)
- English (Nigeria)
- Deutsch
- Español (España)
- Español (México)
- Français
- Italiano
- Nederlands
- Português (Portugal)
- Polski
- Português (Brasil)
- Русский
- Türkçe
- العربية
- Ελληνικά
- Svenska
- Suomi
- עברית
- 日本語
- 한국어
- 简体中文
- 繁體中文
- Bahasa Indonesia
- Bahasa Melayu
- ไทย
- Tiếng Việt
- हिंदी
13 Safe Haven Large Cap Dividend Stocks With Yields Over 3%
Published 09/30/2013, 04:55 AM
Updated 07/09/2023, 06:31 AM
13 Safe Haven Large Cap Dividend Stocks With Yields Over 3%
Latest comments
Loading next article…
Install Our App
Risk Disclosure: Trading in financial instruments and/or cryptocurrencies involves high risks including the risk of losing some, or all, of your investment amount, and may not be suitable for all investors. Prices of cryptocurrencies are extremely volatile and may be affected by external factors such as financial, regulatory or political events. Trading on margin increases the financial risks.
Before deciding to trade in financial instrument or cryptocurrencies you should be fully informed of the risks and costs associated with trading the financial markets, carefully consider your investment objectives, level of experience, and risk appetite, and seek professional advice where needed.
Fusion Media would like to remind you that the data contained in this website is not necessarily real-time nor accurate. The data and prices on the website are not necessarily provided by any market or exchange, but may be provided by market makers, and so prices may not be accurate and may differ from the actual price at any given market, meaning prices are indicative and not appropriate for trading purposes. Fusion Media and any provider of the data contained in this website will not accept liability for any loss or damage as a result of your trading, or your reliance on the information contained within this website.
It is prohibited to use, store, reproduce, display, modify, transmit or distribute the data contained in this website without the explicit prior written permission of Fusion Media and/or the data provider. All intellectual property rights are reserved by the providers and/or the exchange providing the data contained in this website.
Fusion Media may be compensated by the advertisers that appear on the website, based on your interaction with the advertisements or advertisers.
© 2007-2024 - Fusion Media Limited. All Rights Reserved.