Screen Criteria:
List of Apparel stocks with a healthy and positive DuPont profitability sources (Read more by clicking here).
Average Weekly Returns:
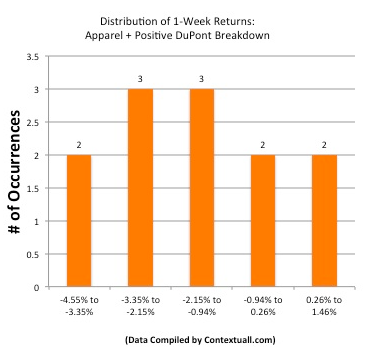
Average 1-Week Return of All Stocks Mentioned Below: -1.59%
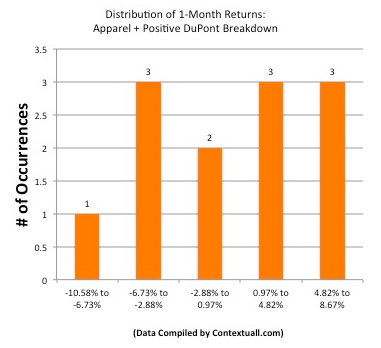
Average 1-Month Return of All Stocks Mentioned Below: 0.23%
Analysis of List Alpha:
Number of Stocks in This List Generating Excess Return vs. SP500 (Beta Adjusted Over Last Week): 0 out of 12 (0.0%)
Number of Stocks in This List Generating Excess Return vs. SP500 (Beta Adjusted Over Last Month): 2 out of 12 (16.67%)
Chart: Distribution of 1-Week Returns For All Stocks Mentioned Below
Chart: Distribution of 1-Month Returns For All Stocks Mentioned Below
(List sorted by monthly performance, from best to worst)
1. Quiksilver Inc. (ZQK): Designs, produces, and distributes branded apparel, footwear, accessories, and related products. MRQ net profit margin at 2.46% vs. 2.07% y/y. MRQ sales/assets at 0.297 vs. 0.291 y/y. MRQ assets/equity at 3.121 vs. 3.206 y/y.
2. Hanesbrands Inc. (HBI): Engages in the design, manufacture, sourcing, and sale of apparel essentials in the United States and internationally. MRQ net profit margin at 9.02% vs. 7.66% y/y. MRQ sales/assets at 0.309 vs. 0.281 y/y. MRQ assets/equity at 5.07 vs. 5.623 y/y.
3. Rocky Brands, Inc. (RCKY): Designs, manufactures, and markets footwear and apparel under the Rocky, Georgia Boot, Durango, Lehigh, Mossy Oak, and Michelin brand names. MRQ net profit margin at 7.4% vs. 7.34% y/y. MRQ sales/assets at 0.369 vs. 0.346 y/y. MRQ assets/equity at 1.596 vs. 1.807 y/y.
4. Foot Locker, Inc. (FL): Operates as a retailer of athletic footwear and apparel. MRQ net profit margin at 6.96% vs. 4.73% y/y. MRQ sales/assets at 0.462 vs. 0.458 y/y. MRQ assets/equity at 1.441 vs. 1.455 y/y.
5. Cintas Corporation (CTAS): Provides corporate identity uniforms and related business services in North America and Latin America, Europe, and Asia. MRQ net profit margin at 7.3% vs. 6.75% y/y. MRQ sales/assets at 0.253 vs. 0.246 y/y. MRQ assets/equity at 1.927 vs. 1.952 y/y.
6. Under Armour, Inc. (UA): Designs, develops, markets, and distributes a range of apparel and accessories using synthetic microfiber fabrications in the U. MRQ net profit margin at 9.97% vs. 9.88% y/y. MRQ sales/assets at 0.533 vs. 0.517 y/y. MRQ assets/equity at 1.422 vs. 1.52 y/y.
7. The Men’s Wearhouse, Inc. (MW): Operates as a specialty retailer of men’s suits in the United States and Canada. MRQ net profit margin at 7.74% vs. 6.82% y/y. MRQ sales/assets at 0.411 vs. 0.405 y/y. MRQ assets/equity at 1.388 vs. 1.402 y/y.
8. Chico’s FAS Inc. (CHS): Operates as a specialty retailer of casual-to-dressy clothing, intimates, complementary accessories, and other non-clothing gift items. MRQ net profit margin at 6.54% vs. 4.92% y/y. MRQ sales/assets at 0.391 vs. 0.368 y/y. MRQ assets/equity at 1.441 vs. 1.447 y/y.
9. Nordstrom Inc. (JWN): Nordstrom, Inc., a fashion specialty retailer, offers apparel, shoes, cosmetics, and accessories for women, men, and children in the United States. MRQ net profit margin at 5.2% vs. 5.13% y/y. MRQ sales/assets at 0.34 vs. 0.297 y/y. MRQ assets/equity at 4.387 vs. 4.398 y/y.
10. V.F. Corporation (VFC): Designs and manufactures, or sources from independent contractors various apparel and footwear products primarily in the United States and Europe. MRQ net profit margin at 12.11% vs. 10.93% y/y. MRQ sales/assets at 0.311 vs. 0.272 y/y. MRQ assets/equity at 2.056 vs. 2.269 y/y.
11. Gap Inc. (GPS): Operates as a specialty retailing company. MRQ net profit margin at 7.97% vs. 5.38% y/y. MRQ sales/assets at 0.483 vs. 0.468 y/y. MRQ assets/equity at 2.533 vs. 2.88 y/y.
12. Genesco Inc. (GCO): Operates Journeys, Journeys Kidz, and Shi by Journeys stores that offer footwear for young men, women, and children. MRQ net profit margin at 6.15% vs. 4.23% y/y. MRQ sales/assets at 0.464 vs. 0.453 y/y. MRQ assets/equity at 1.847 vs. 1.999 y/y.
Original post
- English (UK)
- English (India)
- English (Canada)
- English (Australia)
- English (South Africa)
- English (Philippines)
- English (Nigeria)
- Deutsch
- Español (España)
- Español (México)
- Français
- Italiano
- Nederlands
- Português (Portugal)
- Polski
- Português (Brasil)
- Русский
- Türkçe
- العربية
- Ελληνικά
- Svenska
- Suomi
- עברית
- 日本語
- 한국어
- 简体中文
- 繁體中文
- Bahasa Indonesia
- Bahasa Melayu
- ไทย
- Tiếng Việt
- हिंदी
12 Apparel Stocks With Solid DuPont Profitability Trends
Published 12/14/2012, 02:16 AM
Updated 07/09/2023, 06:31 AM
12 Apparel Stocks With Solid DuPont Profitability Trends
3rd party Ad. Not an offer or recommendation by Investing.com. See disclosure here or
remove ads
.
Latest comments
Install Our App
Risk Disclosure: Trading in financial instruments and/or cryptocurrencies involves high risks including the risk of losing some, or all, of your investment amount, and may not be suitable for all investors. Prices of cryptocurrencies are extremely volatile and may be affected by external factors such as financial, regulatory or political events. Trading on margin increases the financial risks.
Before deciding to trade in financial instrument or cryptocurrencies you should be fully informed of the risks and costs associated with trading the financial markets, carefully consider your investment objectives, level of experience, and risk appetite, and seek professional advice where needed.
Fusion Media would like to remind you that the data contained in this website is not necessarily real-time nor accurate. The data and prices on the website are not necessarily provided by any market or exchange, but may be provided by market makers, and so prices may not be accurate and may differ from the actual price at any given market, meaning prices are indicative and not appropriate for trading purposes. Fusion Media and any provider of the data contained in this website will not accept liability for any loss or damage as a result of your trading, or your reliance on the information contained within this website.
It is prohibited to use, store, reproduce, display, modify, transmit or distribute the data contained in this website without the explicit prior written permission of Fusion Media and/or the data provider. All intellectual property rights are reserved by the providers and/or the exchange providing the data contained in this website.
Fusion Media may be compensated by the advertisers that appear on the website, based on your interaction with the advertisements or advertisers.
© 2007-2024 - Fusion Media Limited. All Rights Reserved.
