MACRO
Stocks had a solid showing on Friday afternoon, taking what had been a dull day, and making a late-day surge. Friday afternoon trading can be very telling as to how the market is feeling. There was a time, a very long time ago, where Friday’s were dreaded, as nobody wanted to be long going into the weekend. During periods of uncertainty, this is very true. Bidding stocks up into a Friday close is a sign of confidence and would suggest to me the market’s recent rise isn’t over.
S&P 500
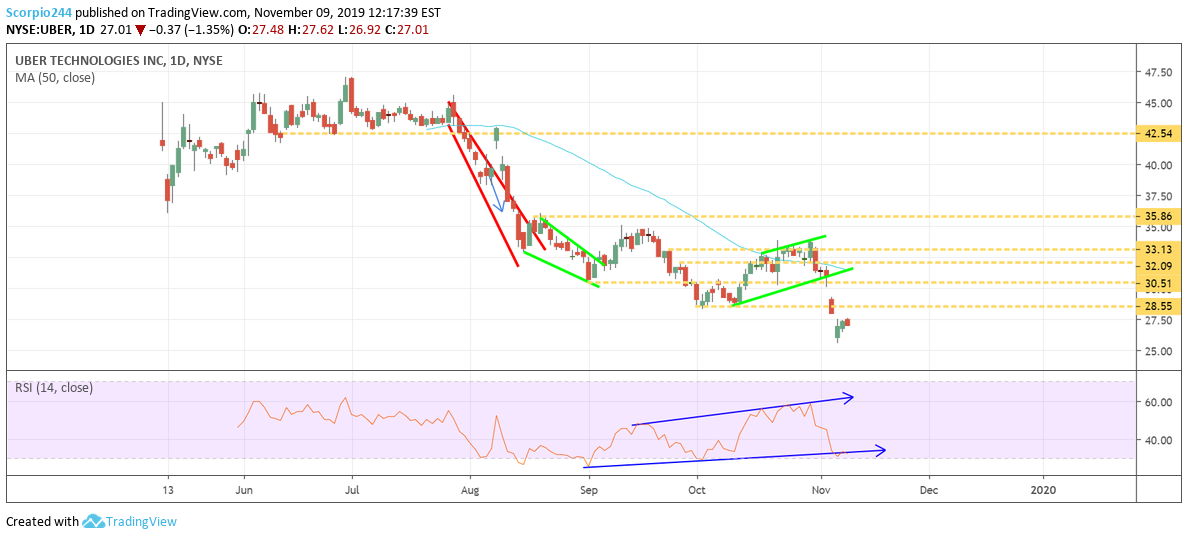
The SPY chart shows the creation of a rising channel, and if that pattern holds, it would indicate to me that we should see the S&P 500 push towards 3,110 this week. But ultimately, I believe, the next significant level of resistance for the S&P 500 will come around 3,150.
Russell 2000 (IWM)
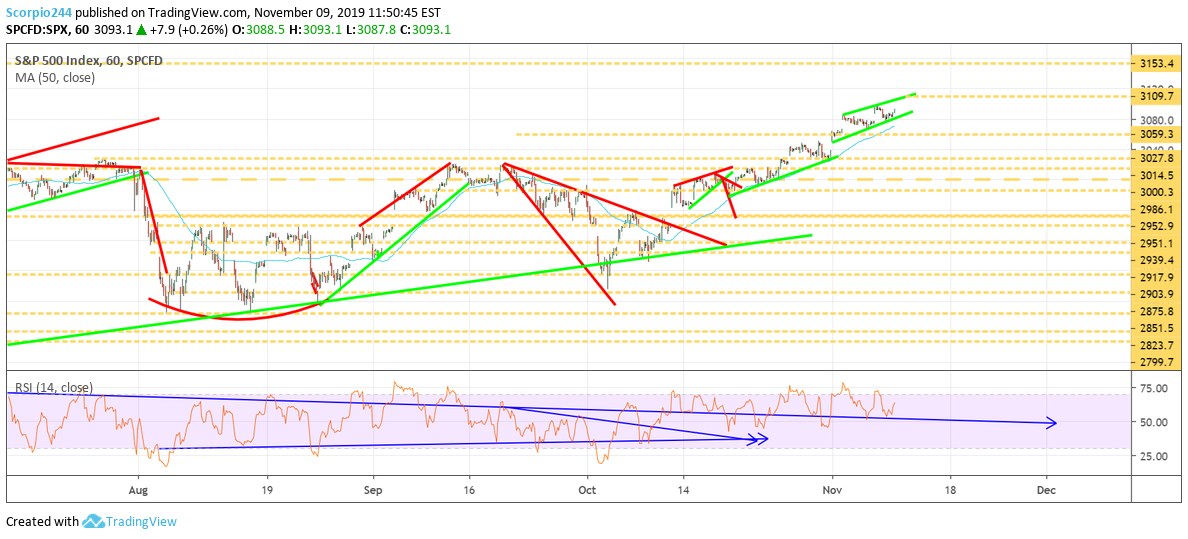
The Russell 2000 appears to be getting ready for big push over 1,600. We can see the strong channel it is in, and the consolidation we are currently witnessing.
Oil
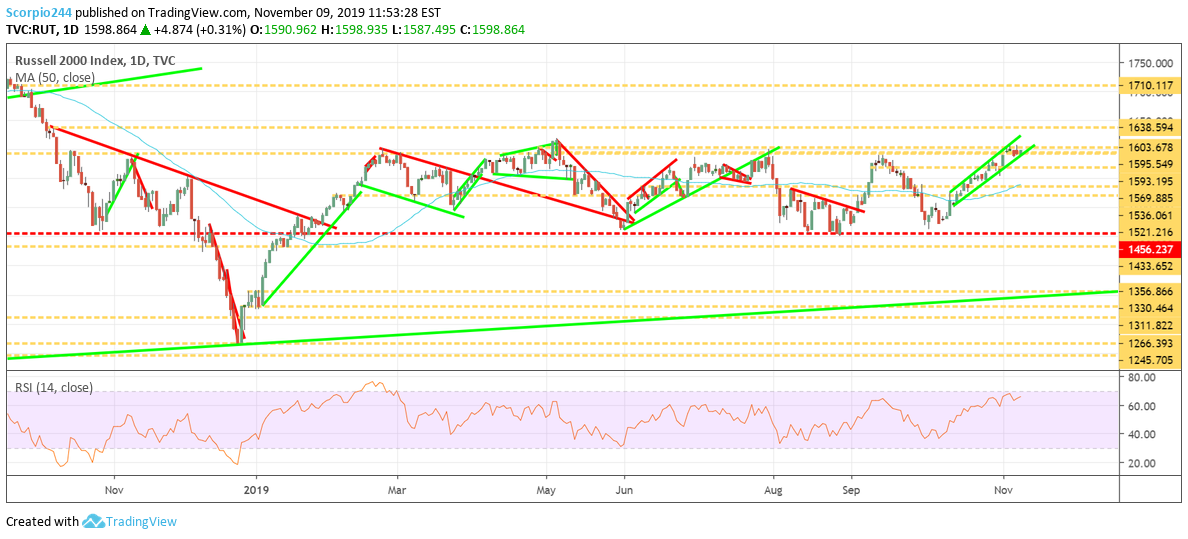
Oil is approaching a short-term break out that could send it back to $61.50.
STOCKS
AMD (AMD)
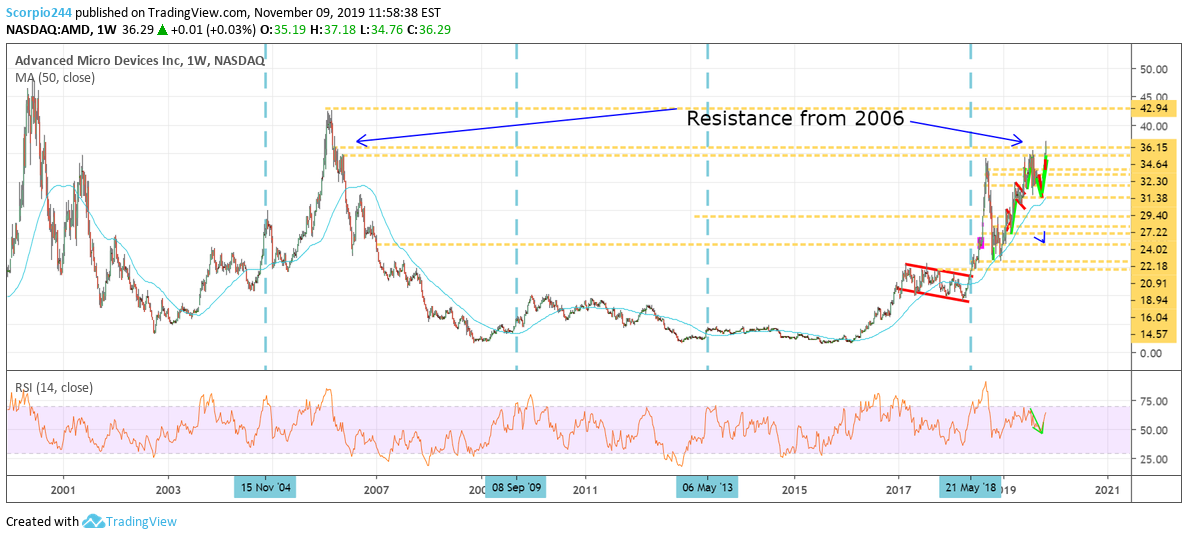
I have backed off covering Advanced Micro Devices (NASDAQ:AMD), as I continue to lick my wounds from the earnings beatdown I took thinking the stock would fall. Stupid me. It happens, so we pick ourselves up and move forward. Anyway, the shares look overbought here on the daily RSI.
Additionally, the $36.25 region may prove to be a challenging level of resistance that dates back to the year 2006. If the stock can manage to break out, perhaps, it goes to $42. I don’t think the time is now, and the shares fall back to around $34.64.
Microsoft (MSFT)
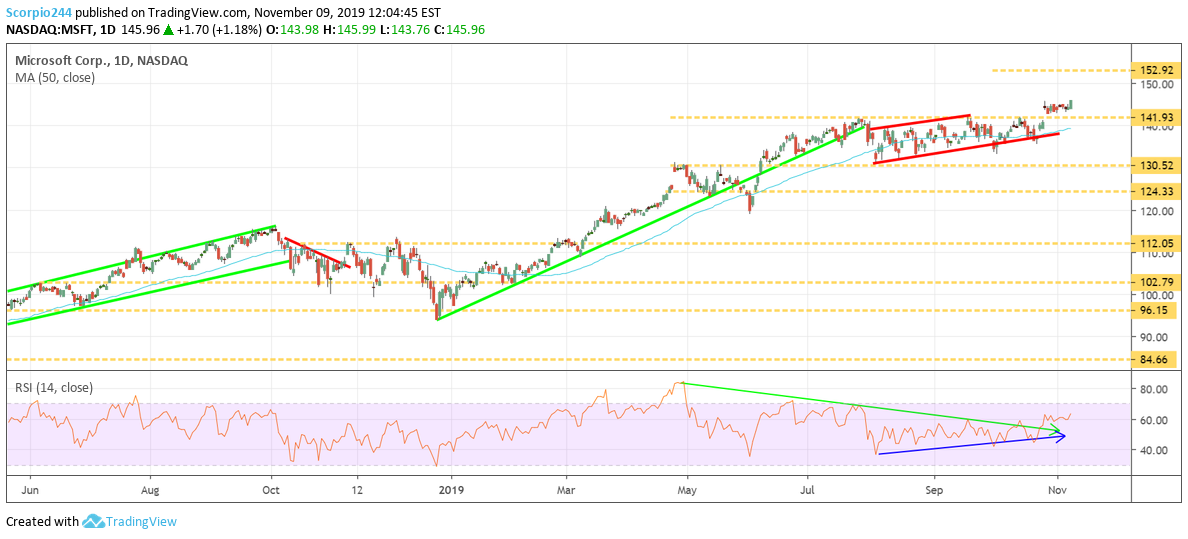
Microsoft (NASDAQ:MSFT) has been consolidating in the $144 range, and now the stock appears to be breaking out and maybe making its move to $153.
Twitter (TWTR)
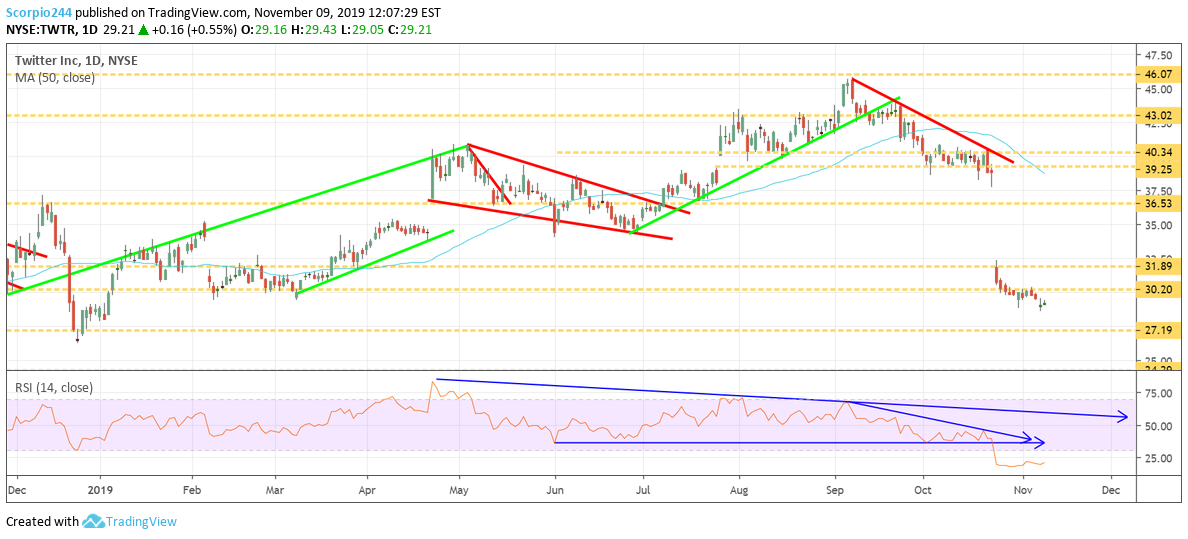
I have been getting asked a lot about Twitter, and I’m not sure where this goes next, to be honest. The chart looks completely broken, and there is a robust level of resistance $30.20, which limits the upside. Unfortunately, i think it drops to $27.20.
Baidu (BIDU)
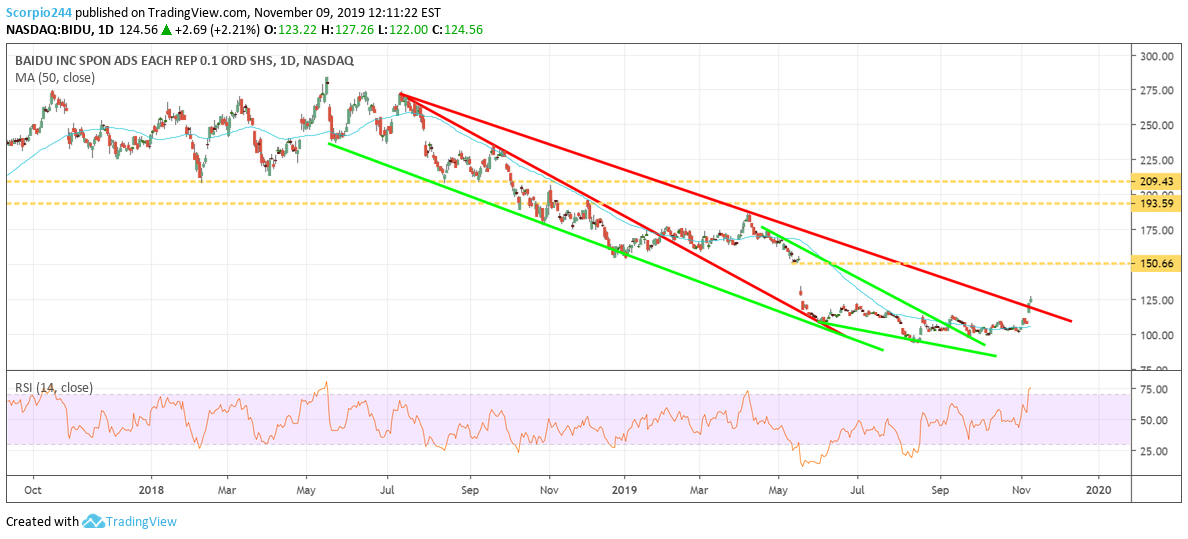
Baidu (NASDAQ:BIDU) is a stock that recently broke a very long-term downtrend. Perhaps the stock fills the gap back $151.
Twilio (TWLO)
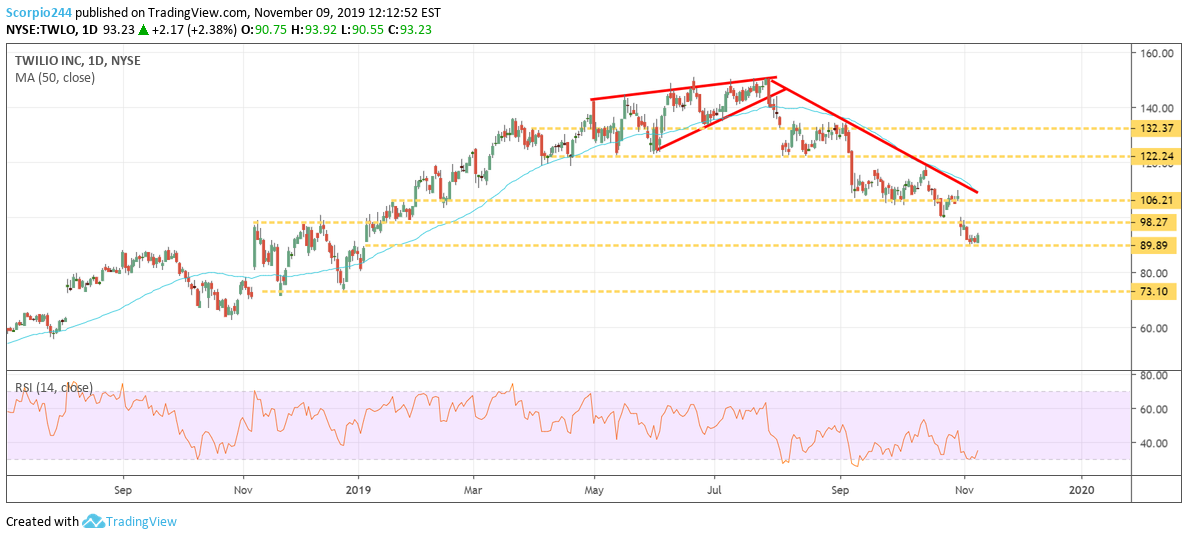
Twilio (NYSE:TWLO) looks like a mess, and I can’t emphasize enough the importance of support at $89. If that breaks, the stock can quickly fall to $73.
Kraft-Heinz (KHC)
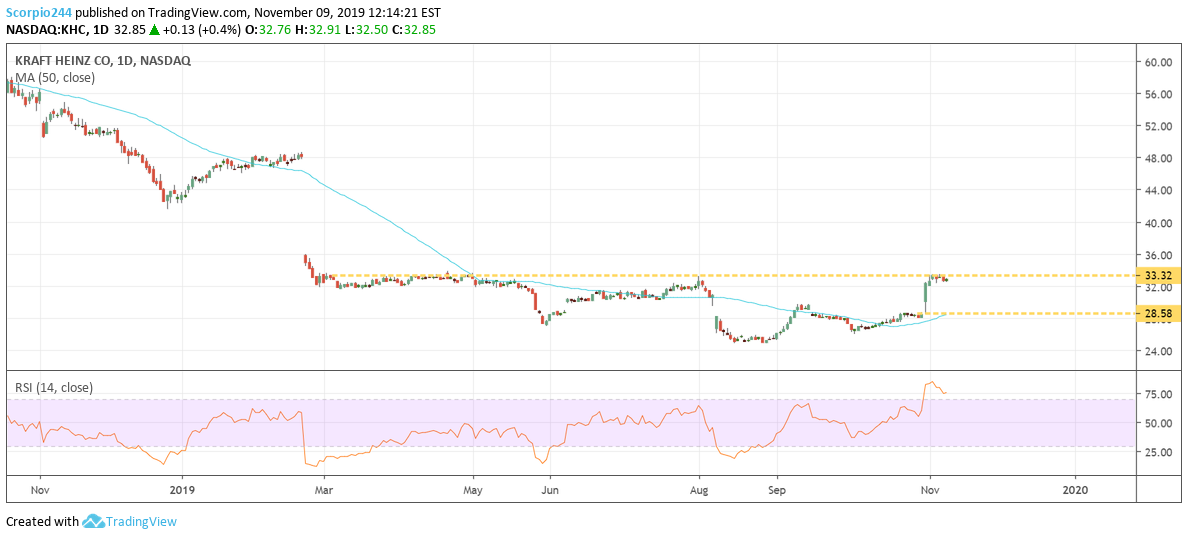
Kraft Heinz (NASDAQ:KHC) – play it if you dare. The stock is sitting at resistance at $33.30. The RSI says it is overbought and I think the stock heads lower back to $28.50
The Trade Desk (TTD)
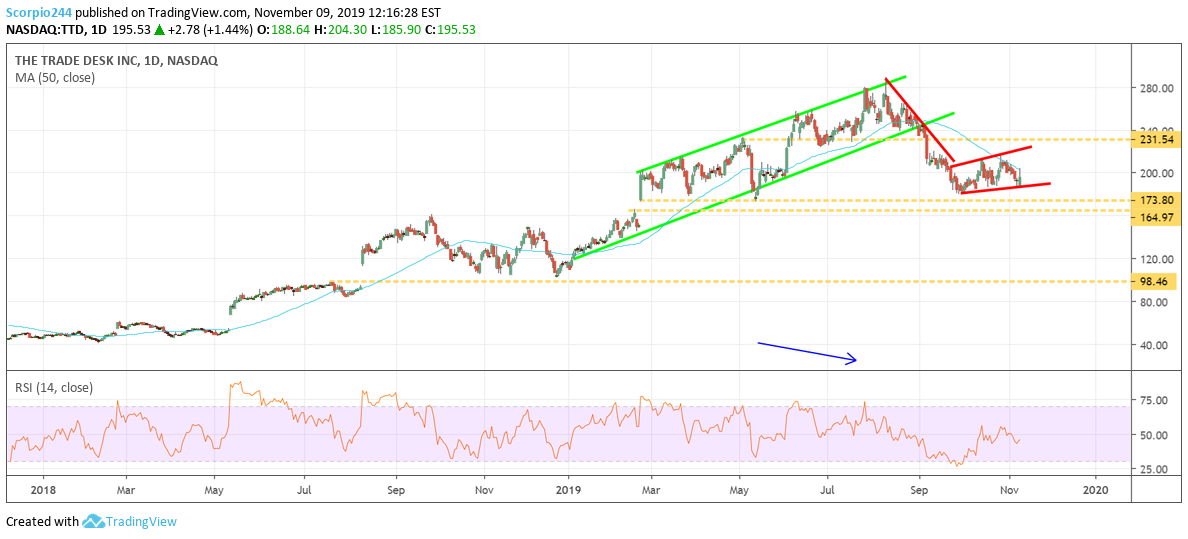
Trade Desk Inc (NASDAQ:TTD) doesn’t look like it is in a strong position. It almost seems as if there is a bear pennant that has formed, and that means $162 and a gap fill seem possible.
Uber (UBER)
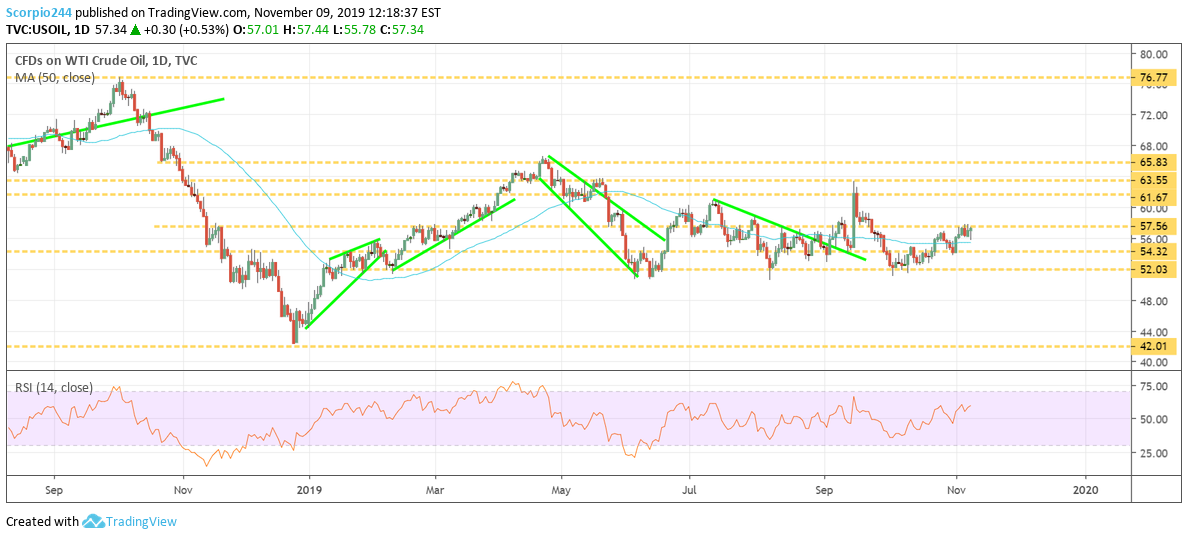
Uber (NYSE:UBER) is a complete disaster. Resistance is $28.50. How far it can fall is anyone’s guess.
