


Sign up to create alerts for Instruments,
Economic Events and content by followed authors
Free Sign Up Already have an account? Sign In
Please try another search
If you haven’t been living in a dark cave for the last 20 years, you’ve heard of “Black Friday” - the shopping holiday in which retailers offer special sales, sometimes at a loss, to get consumers to do their holiday shopping with them.
Black Friday has been an American tradition since the 1960’s, but was only popularized in the early 2000’s in the rest of the world. It used to mark the beginning of the holiday season, and it was nicknamed to as “Black Friday” because it referred to businesses moving from “red” to “black” - in manual accounting this signifies the move from loss (in red ink ) to profit (in black ink).
According to CNBC, since 2007, the top U.S. equities sector in the period spanning from one week before to one week after Black Friday has been retail.” When checked, it was found that “a grouping of S&P 500 retail stocks, on average, posts returns of 5 percent during that time frame. That compares with the S&P 500 index’s average return of about 3 percent, and consumer discretionary stocks seeing about 4.5 percent growth in their share prices.”

In the meantime, BusinessInsider.com found that users of the app Robinhood, mainly millennials, chose to trade retail stocks at a rate 50% higher than usual in the weeks before Black Friday.
We used our Historical Data Feature to examine 5 major U.S. retailers’ stocks in the week leading to Black Friday during 2014-2017. The numbers told an interesting story, with some results we weren’t expecting as you can see in the graph below - some stocks were quite volatile when compared to previous years, while others barely budged. On average, it may be safe to expect retail stocks to go up by at least 1%, with some possibly bringing you 3%-4%. Amazon seems to capitalize on Black Friday more effectively than its competitor, as people elect to make their purchases from home, rather than fight the hordes of shoppers in stores.
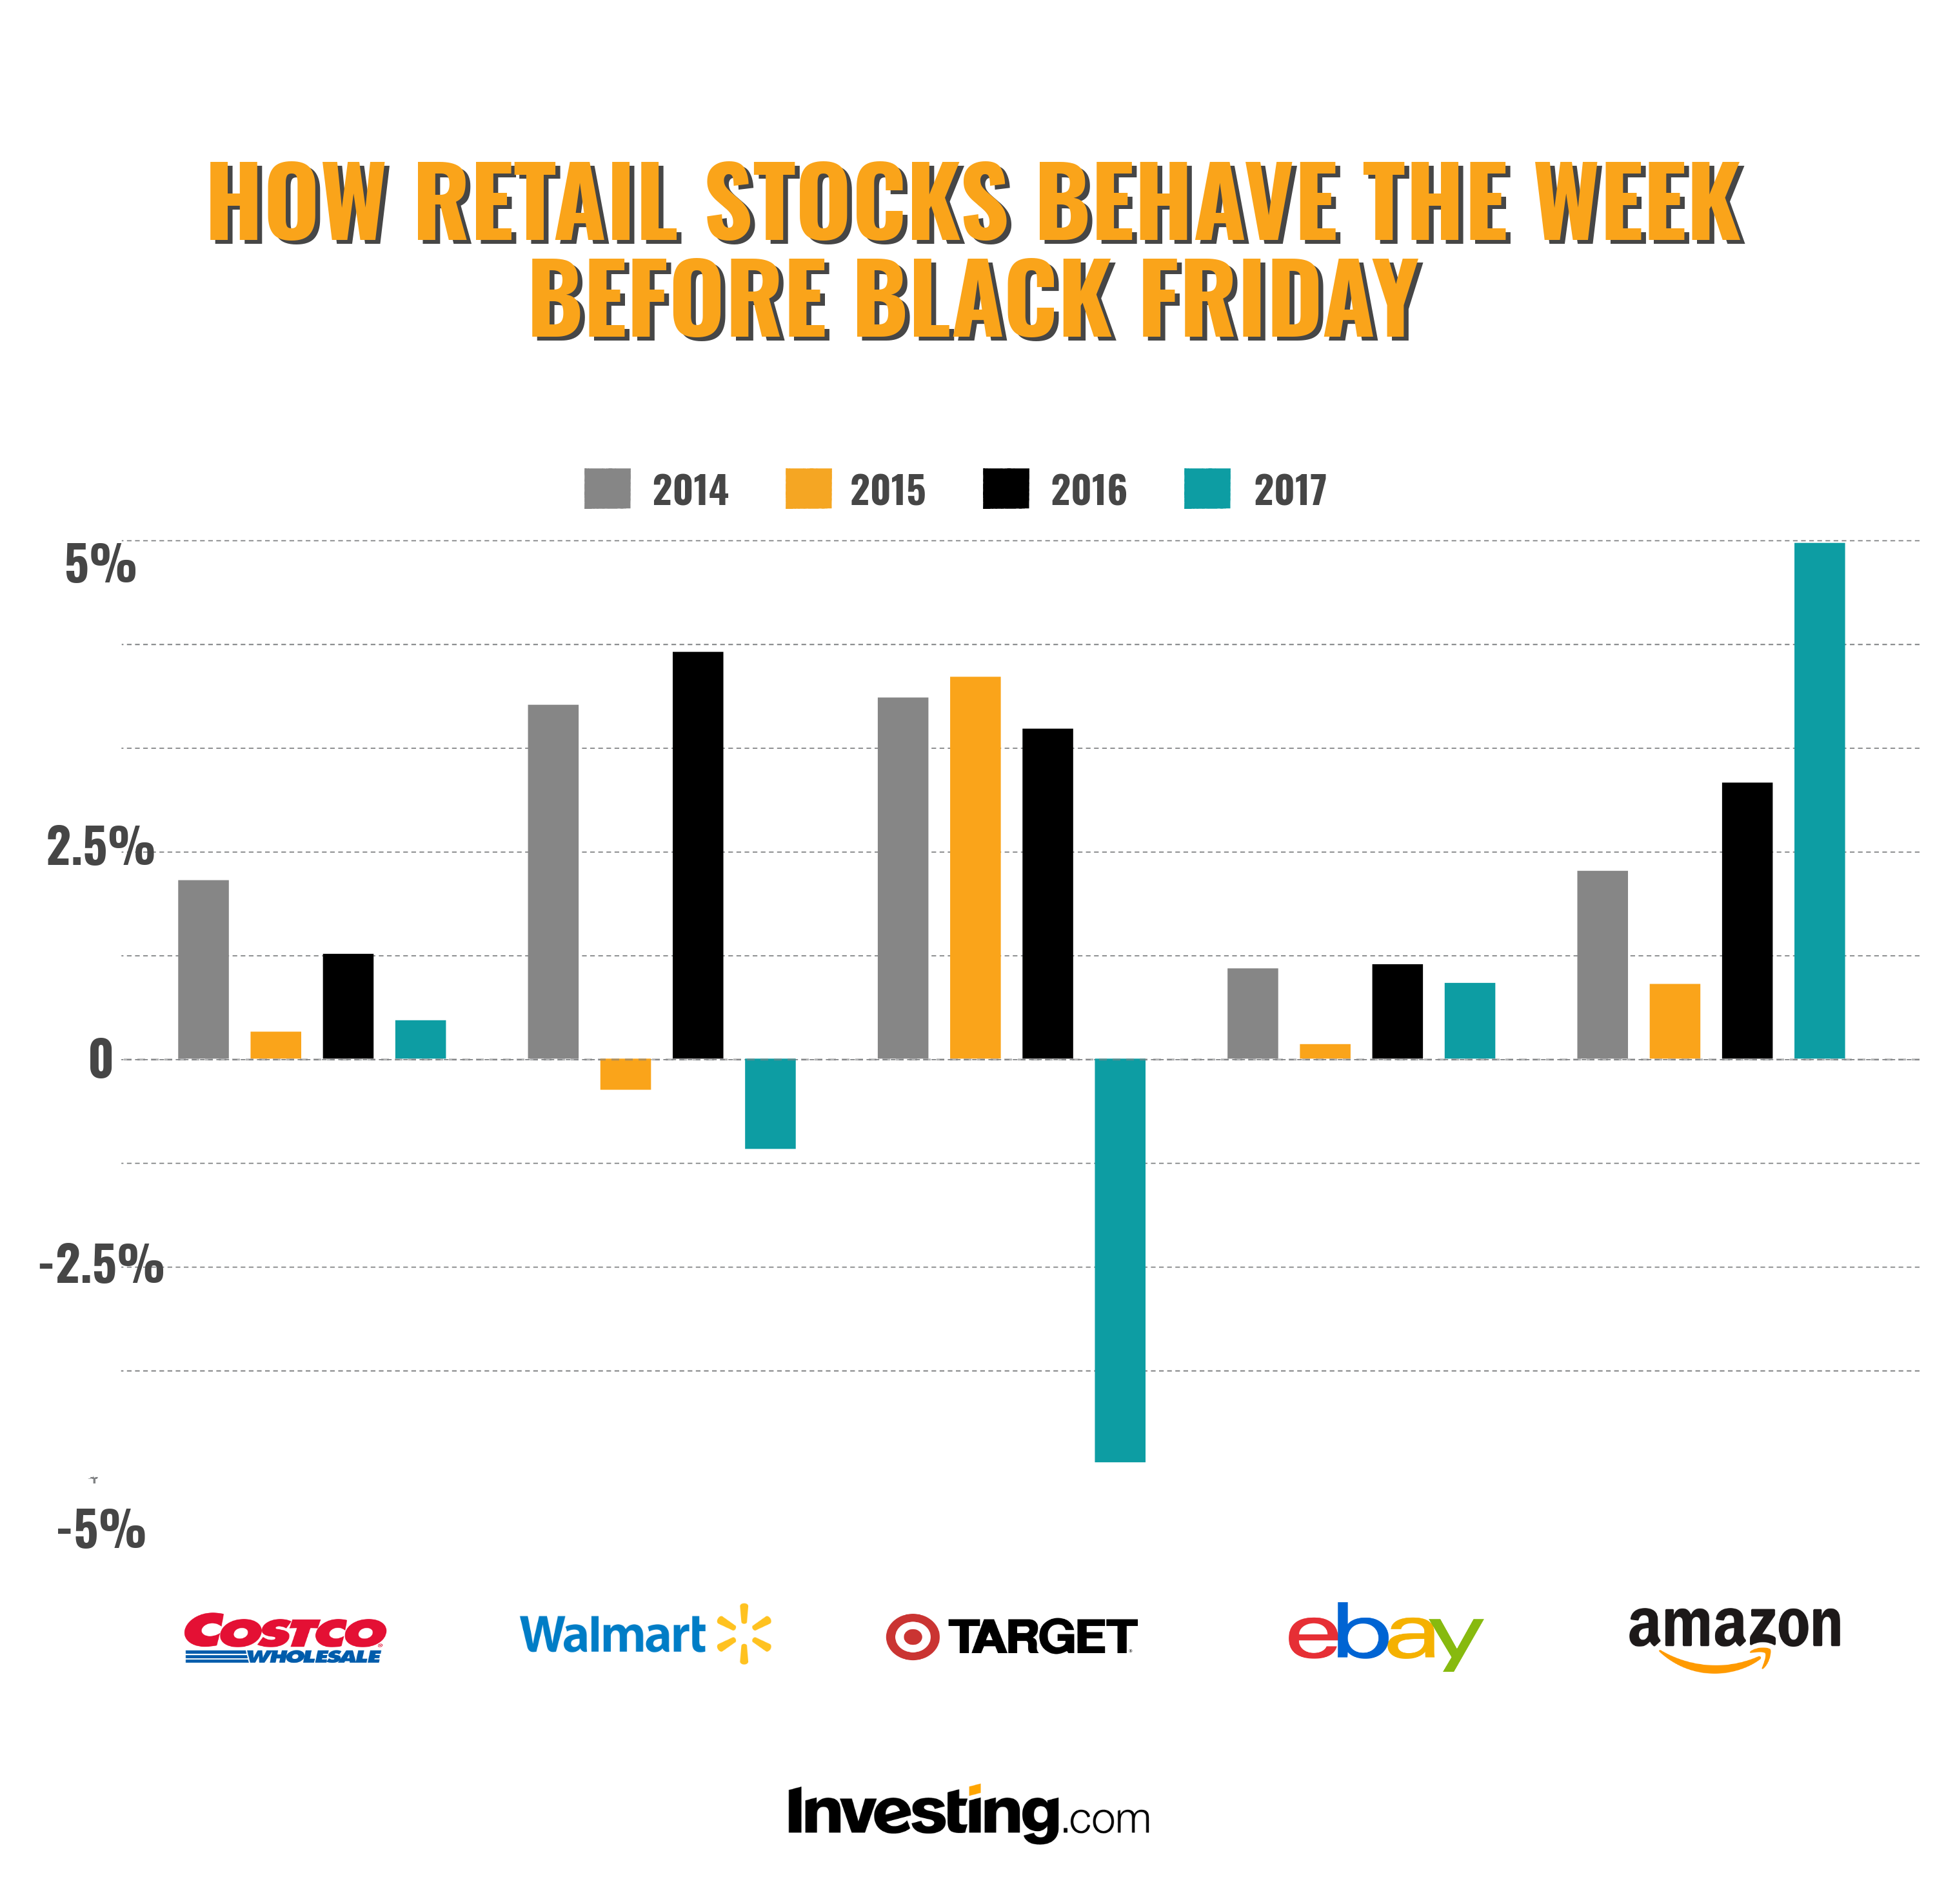
Costco’s (NASDAQ:COST) stock, while still gaining each year, seems to be losing momentum. Could it be because shoppers elect to do more and more of their shopping online, rather than in brick and mortar stores?
Walmart’s (NYSE:WMT) stock, on the other hand, seems to go through a “yo-yo” effect with even years showing more than 3% increase, while odd years end in a small decline. What will this mean for 2018?
Target’s (NYSE:TGT) stock surprised us - from 2014 to 2016, the stock climbed up by over 3%, but in 2017 the stock tanked by almost 4%. This was probably the result of an unfavorable quarterly earnings report, rather than anything to do with Black Friday itself.
eBay.com (NASDAQ:EBAY) - one of the largest online marketplaces, seems to be barely affected by Black Friday hype, gaining less than 1% during the week leading to Black Friday YoY.
Amazon.com (NASDAQ:AMZN) continues to rise in value every year on the week leading up to Black Friday, gaining almost 5% in 2017. While the Amazon stock has been on a freefall since October ‘18, we can’t help but wonder if this year’s Black Friday will bring share prices back up.
Infographic created in collaboration with appinstitute.com
Finally, the website Shoppimon found that during the shopping season of 2017 (Thanksgiving, Black Friday and Cyber Monday), online retailers lost $1.88 billion to website crashes and cart abandonment due to slowness or processing issues. This amounts to about %13 of total sales, and may serve as an indicator for online retailers in 2018 to make sure their website infrastructure can handle the increased traffic.
The answer to this question is probably “yes”, but with a caveat - some retailer stocks seem to exhibit higher volatility than others, going up 3% one year, only to go down 1% the next year. Others seem to be more stable, but can still surprise you. What you may want to consider doing, before trying to long these stocks, is to do your research. Take a look at the historical data to see how the stock behaves on average and check the company’s latest earnings report before you make a decision whether or not to invest.
Note: This post should not be considered an endorsement, nor investment advice. Do your due diligence before investing in any particular asset or asset class.
Are you sure you want to block %USER_NAME%?
By doing so, you and %USER_NAME% will not be able to see any of each other's Investing.com's posts.
%USER_NAME% was successfully added to your Block List
Since you’ve just unblocked this person, you must wait 48 hours before renewing the block.
I feel that this comment is:
Thank You!
Your report has been sent to our moderators for review
Add a Comment
We encourage you to use comments to engage with other users, share your perspective and ask questions of authors and each other. However, in order to maintain the high level of discourse we’ve all come to value and expect, please keep the following criteria in mind:
Enrich the conversation, don’t trash it.
Stay focused and on track. Only post material that’s relevant to the topic being discussed.
Be respectful. Even negative opinions can be framed positively and diplomatically. Avoid profanity, slander or personal attacks directed at an author or another user. Racism, sexism and other forms of discrimination will not be tolerated.
Perpetrators of spam or abuse will be deleted from the site and prohibited from future registration at Investing.com’s discretion.