by Pinchas Cohen
Key Events
- While in a bear market, oil is having its strongest run of the year
- Yen weakened by political uncertainty; Japanese equities rally
- Chinese government saves face: official report in line with private gauge, confirming growth data
- Global tech stocks' top completed
- Dollar’s decline expected to continue
Global Affairs
Global equities are near record highs on a renewed and improved growth outlook. The optimism is attributed to last week's corrective rise in oil and major central banks reporting increased confidence in their respective markets.
Asia
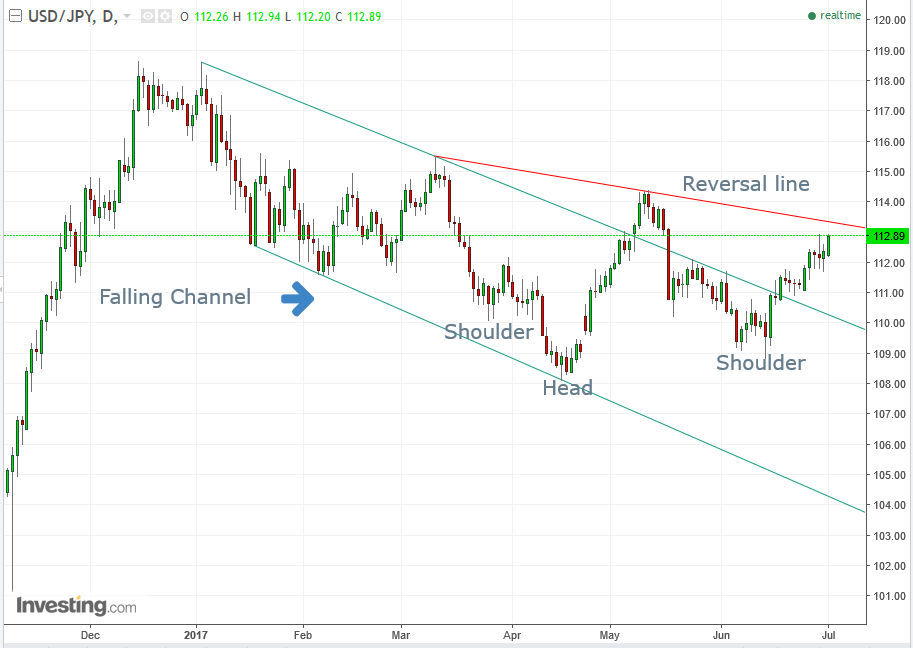
The drive to buy oil, which is set for its eighth straight gain—its longest streak of the year—has caught on in Asian stock markets. The scramble for oil is so powerful that it is overshadowing the yen’s effect on Japanese equities. While the JPY has been fluctuating on the colossal defeat of Japanese Prime Minister Shinzo Abe’s Liberal Democratic Party for the Tokyo Municipal Assembly, equities continue to climb. Once again we see the political sensitivity of currency traders, as the yen has fluctuated on the uncertainty of the political blow to Abe, while stock traders saw no reason to stop investing.
Even so, Japan's biggest manufacturers are enjoying their highest confidence levels in three years. The BoJ’s Tankan Report—a quarterly survey of more than 10,000 manufactures—rose for its third consecutive quarter from the previous 12, beat market expectations of 15, and hit 17. This would normally help Prime Minister Shinzo Abe, as one of his major goals is to revitalize of the economy. However, the host of scandals during his presidency, compiled with his party’s loss in Tokyo's municipality, shows he suffers from low public support for his administration.
While Japanese shares got a boost on better-than-expected economic data, Chinese shares did not enjoy a similar boost, even on the heels of positive economic release showing manufacturing picked up in June.
The private gauge of sentiment in China’s manufacturing, the Caixin and Markit Economics' manufacturing index, climbed to 50.4 from 49.6 in May.
What’s surprising about the indifference of Chinese equities to this good news is twofold: (1) that it comes after last month's reading, the first time since June 2016 that the index slipped under 50. June’s rebound suggests that May’s data was an anomaly, and (2) as we pointed out last month, the private gauge declined, even as the official government gauge climbed, increasing investor suspicion regarding the reliability of official Chinese data.
This dual rebound should dispel at least some of those suspicions. However, investor fears of continuous regulatory tightening on liquidity are prompting them into a defensive posture.
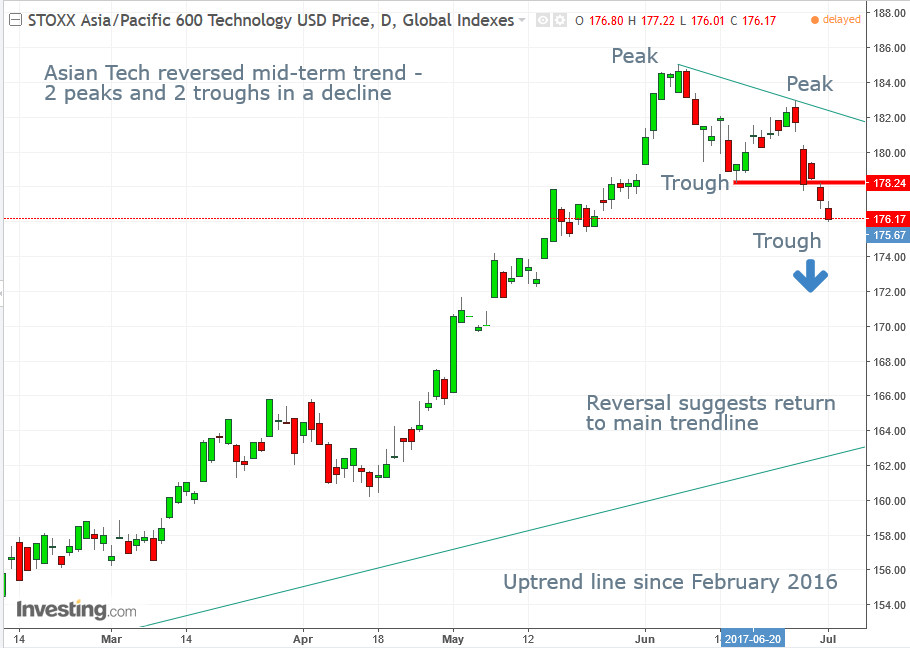
The TOPIX is up 0.16% at 2:36 EDT, and the TOPIX Oil and Coal Products rose a full 1-percent, while Asian tech stocks are down 0.61%. This suggests that energy is the current local market leader.
Europe
While the tech sector was in decline in Asia, it opened higher in Europe, but only after completing a reversal. Therefore, today's rise is considered merely a correction—the same situation as oil.
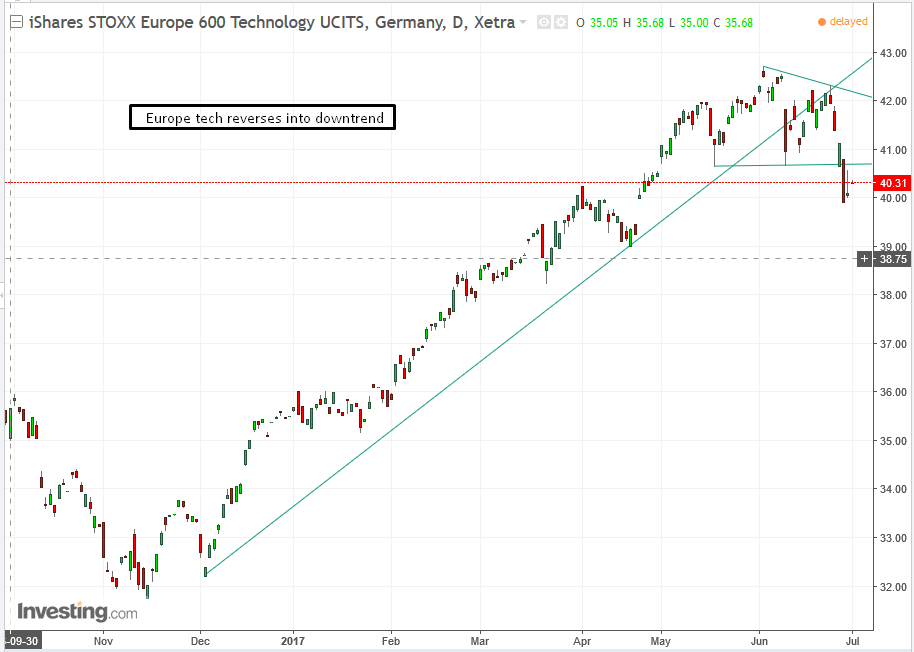
What did remain consistent is energy leadership. The iShares STOXX Europe 600 Technology (DE:SX8PEX) is up 0.52 percent at 4:21 EDT, but the iShares STOXX Europe 600 Oil & Gas ETF (DE:SXEPEX) has also risen 1.12 percent. The same leadership role for energy that was visible in Asian markets remains in power for the European session as well.
The Dollar
While equities continue to be among the assets showing the most gains this year, the dollar is among the worst performers, and is expected to decline further. Bloomberg reports that the dollar has fallen after nine of the last ten Nonfarm Payroll releases, despite the reports beating expectations. The dollar is stagnant on good news but retreats on bad data—the telltale sign of a bear market.
Trump and Mnuchin wanted a weak dollar and they got it. Ironically, the euro—which was left without hope after the Brexit vote and with the rise of eurosceptic populism in Europe—remains the best performing currency this year. The European economy has consistently released positive output data, while the US has been steadily disappointing investors.
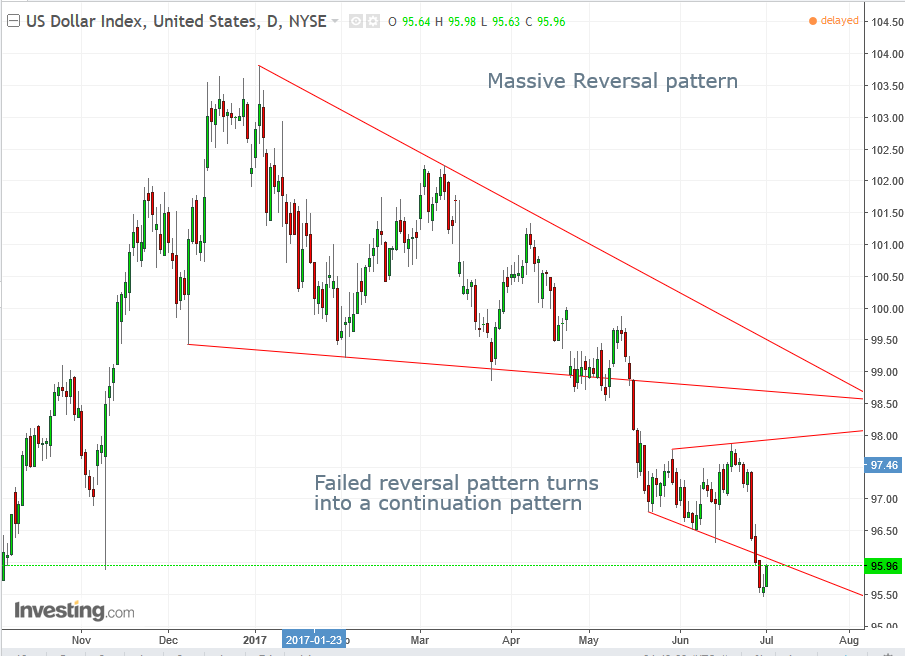
This negative bias has been displayed on the charts, starting with the top and reinforced with a bearish continuation pattern which completed last Thursday.
Upcoming Events
- The New York Stock Exchange will close for Independence Day, starting on Monday at 1 PM.
- The FOMC Minutes for June 13-14, when interest rates were raised, will be released.
- A two-day G-20 summit in Hamburg will start on Friday. President Donald Trump is expected to meet Russian President Vladimir Putin, the first time the two will see each other face-to-face.
- Friday’s NFP expectations are 175,000 new jobs for June, along with increased wage growth.
Market Moves
Stocks
- The Stoxx Europe 600 increased 0.7 percent as of 8:17 a.m. in London, with energy companies jumping up 1.2 percent.
- Japan’s TOPIX rose 0.2 percent.
- Australia’s S&P/ASX 200 declined 0.7 percent.
- Hong Kong's Hang Seng and China's Shanghai Composite climbed 0.1 percent.
- S&P 500 Futures advanced 0.33 percent.
- The S&P 500 rose 0.2 percent on Friday to round out its worst week since April.
Currencies
- The Dollar Index rose 0.35 percent after dropping 1.65 percent last week, touching its lowest level since October.
- The yen fell 0.3 percent to 112.64 per dollar, after erasing an earlier advance of as much as 0.4 percent.
- The South Korean won lost 0.2 percent.
- The pound fell 0.1 percent to $1.3011, after an eight-day rally.
- The euro slipped 0.2 percent to $1.1402.
Bonds
- The yield on 10-year Treasuries rose one basis point to 2.32 percent, adding to a 16-basis point surge last week, its steepest since March.
- Australian benchmark yields jumped seven basis points to 2.67 percent.
- UK 10-year yields added four basis points to 1.29 percent. French and German 10-year yields were little changed.
- China’s bond connect program with Hong Kong will give offshore investors another way to access the mainland’s $10 trillion debt market.
Commodities
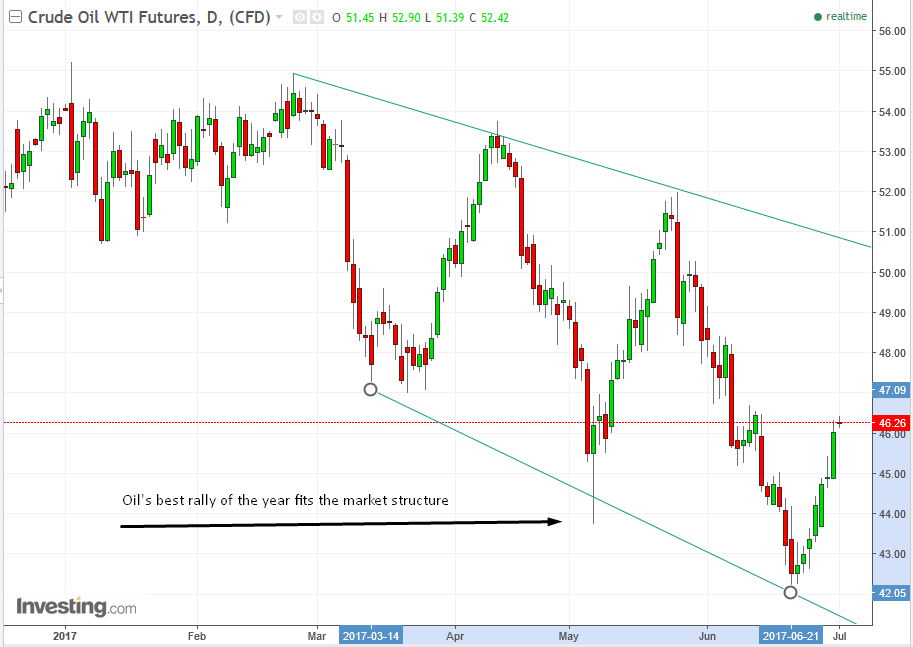
- Crude rose 0.6 percent to $46.32 a barrel. WTI has rallied 8.9 percent over eight days, after tumbling more than 20 percent from the year’s peak to enter a bear market.
- Gold slipped 0.4 percent to $1,236.41 an ounce.
