by Pinchas Cohen
The Big News
- Japan leads Asian markets, whereas China produces contradictory official data, raising renewed questions about government reporting
- Yen slips, while onshore yuan is set for largest 4-day gain in nearly 12 years
World Events
Japanese equities led Asian stocks on better-than-expected capital spending, but they were unable to keep wayward Chinese shares in line. China’s Caixin Manufacturing PMI, a non-government gauge, fell below 50, the line between expansion and contraction, for the first time in eleven months. This report is in contrast with yesterday's official, government PMI, which indicated manufacturing remained steady. If that contradiction weren't enough, the government report suggested a manufacturing sector recovery was spreading to the smaller private sector.
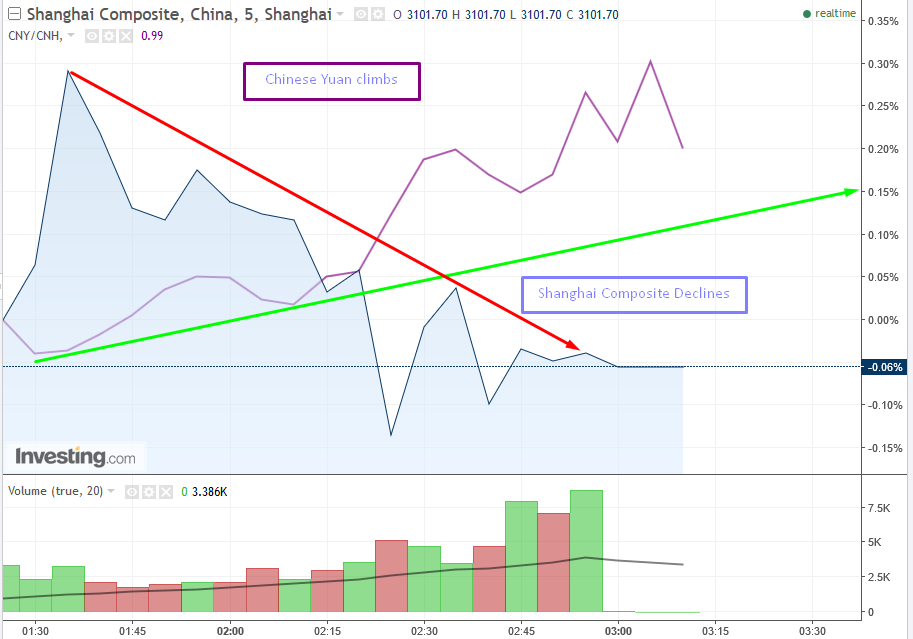
Is this another example of why investors don’t trust China’s data, or is the private gauge’s smaller sample study not statistically representative? Is the private Caixin PMI gauge accurate? Caixin responded to criticisms saying that its private PMI report coincided with its findings of slower increases in output and new orders.
In Tuesday’s post we wondered whether there's a global economic leadership change in progress from China to Europe. The results of today's China PMI adds to the evidence that the country's growth may have already peaked this year, after fading in other fields such as satellite imagery to metal prices. It may be time to declare that China’s factory reflation is over.
In Japan, the yen's fall is driving Asian shares, and China's slowing economy is fueling the onshore yuan in its biggest 4-day advance in almost 12 years. This is due to speculation that Chinese interest rates will be raised as the country tries to discourage bets against its currency as well as capital flight, resulting in the yuan falling nearly 7 percent– its biggest annual loss against the dollar since 1984, on worries about shaky growth earlier in the year and a surging dollar. As a result, China raised short-term interest rates in March for the third time in as many months.
Supporting the yuan has been a matter of Chinese policy this year, as China tries to slow down the capital outflows and prevent financial shocks right before the ruling Communist Party changes leadership at the end of the year. Ironically, the yuan’s rally, after months of equilibrium with the dollar, rose in spite to Moody’s Investors Services which downgraded China’s sovereign debt last week.
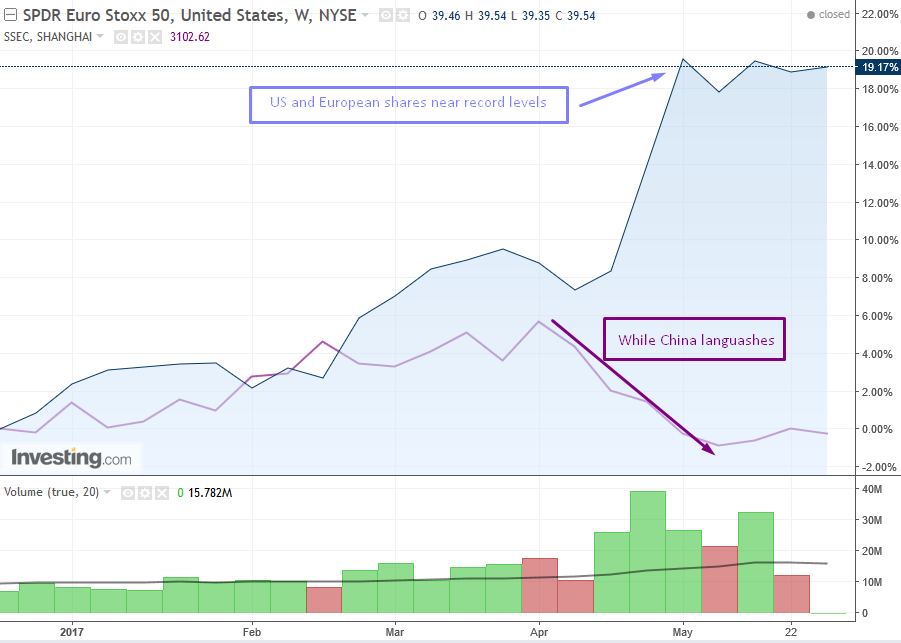
While the private PMI report adds to the evidence that China has peaked for the year, optimism in the global economy is being boosted by positive earnings, sending global exchanges, such as the Euro Stoxx 50 and the NYSE, to almost record highs. This newfound optimism offsets concern for the inflation outlook.
In Japan, capital spending of the first quarter beat expectations, while corporate profits leaped 27 percent.
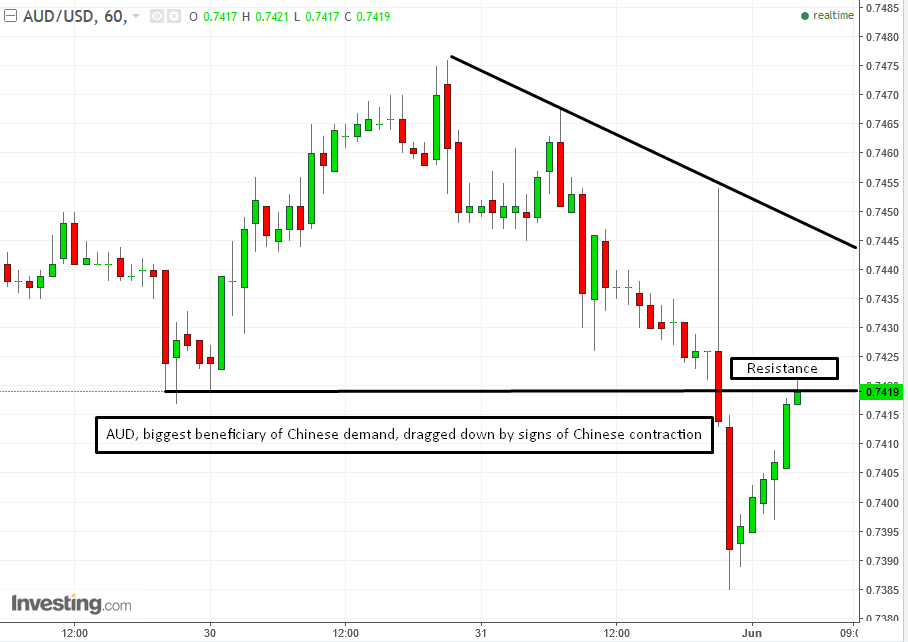
The Australian dollar, an innocent bystander when it comes to China's economic shifts, has once again been hit by collateral damage since it's China’s biggest two-way trading partner.
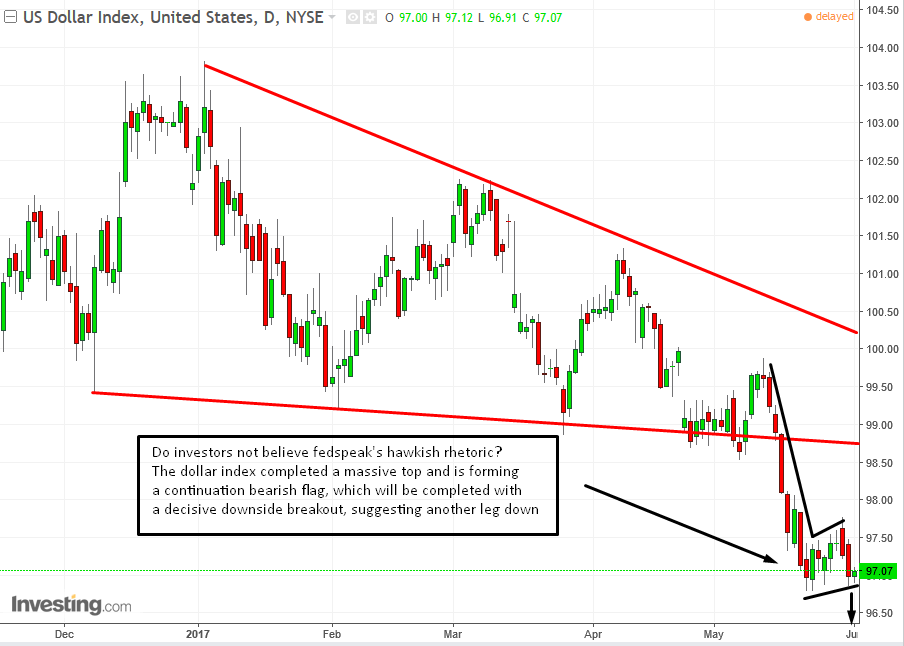
In the US, Federal Reserve Bank of San Francisco President John Williams said in Seoul that the Fed can still raise interest rates even four times this year, if the US economy is strong enough. The upcoming Nonfarm Payroll jobs report this Friday may give traders a clue about the policy meeting that's only two weeks away.
To balance William’s hawkish rhetoric, Federal Reserve Bank of Dallas President Robert Steven Kaplan is concerned about recent declines in the core measure of inflation. Bond traders seem to share the same concern, as 10-year Treasuries just ended four straight months of gains.
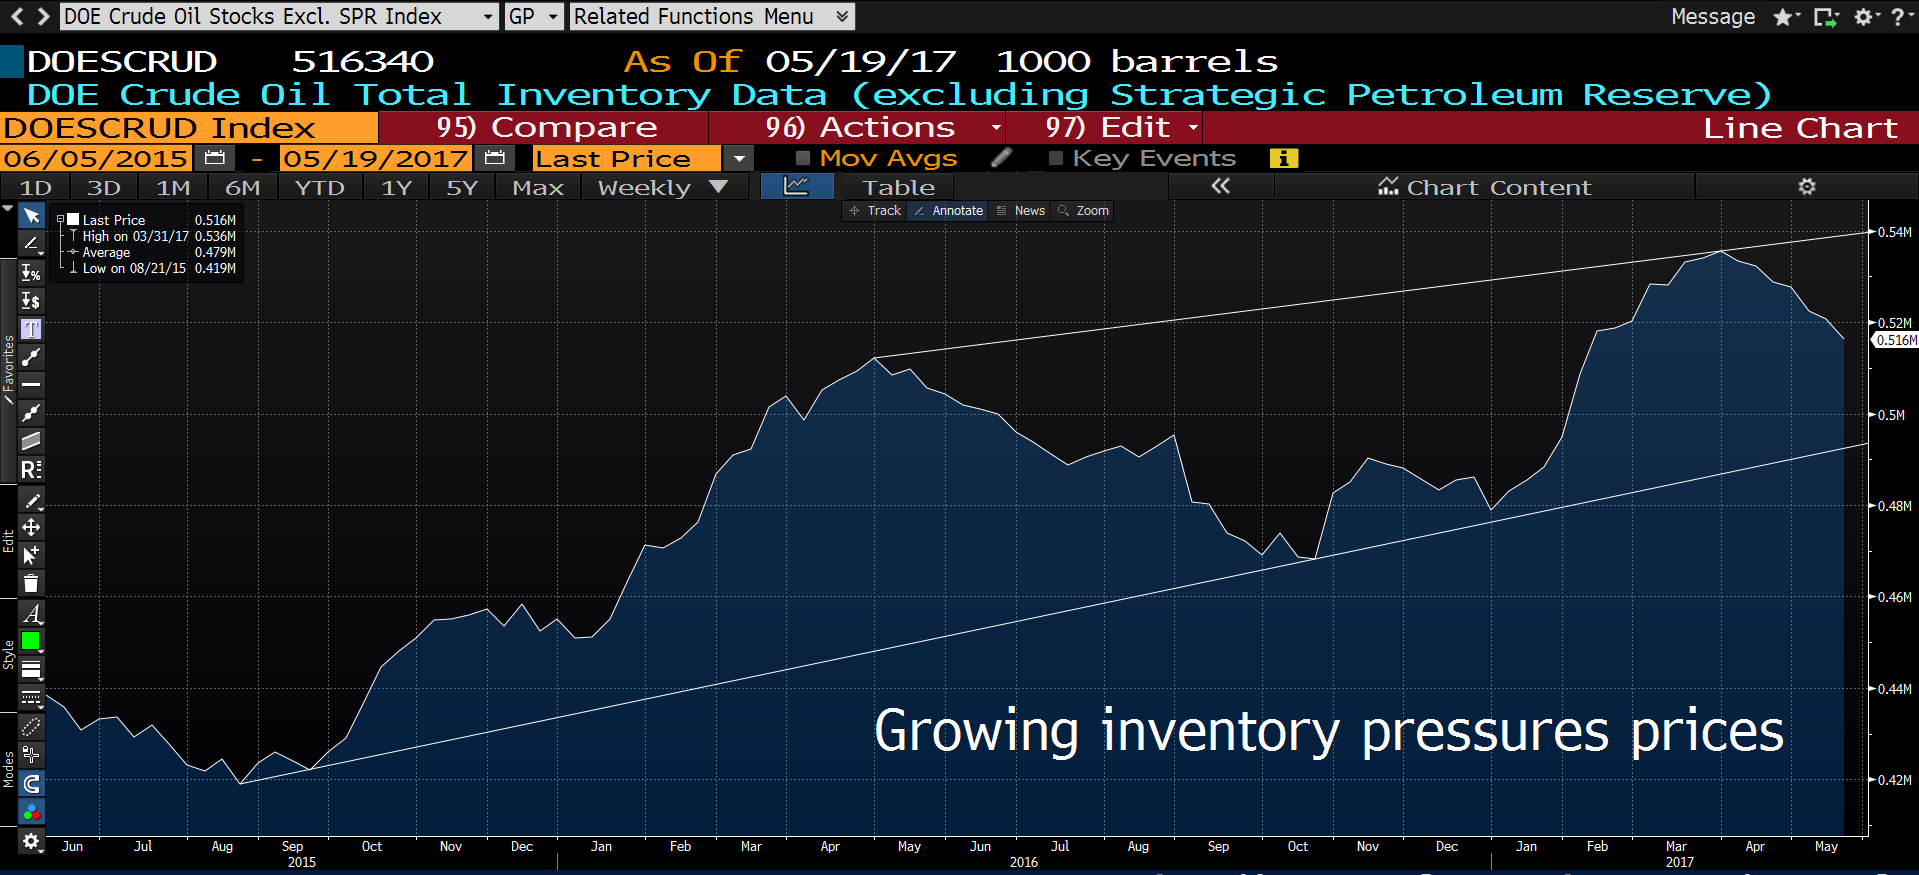
Oil rebounded on a report released by the American Petroleum Institute API, that US inventories fell by 8.67 million barrels last week. The Energy Information Administration, which releases the official government data today, is expected to report a drop of 3 million barrels – which, if accurate, would be the eighth straight weekly drop.
Oil futures climbed 1.2 percent in New York, paring some of the 3 percent loss of the previous two sessions, even as output from Libya – which isn’t part of the OPEC deal – climbed to the highest since October 2014.
Upcoming Events
- The US nonfarm payroll jobs report release at 8:30 EDT Friday, may play a key role in the FOMC's upcoming interest rate decision in two weeks.
Market Moves
Stocks
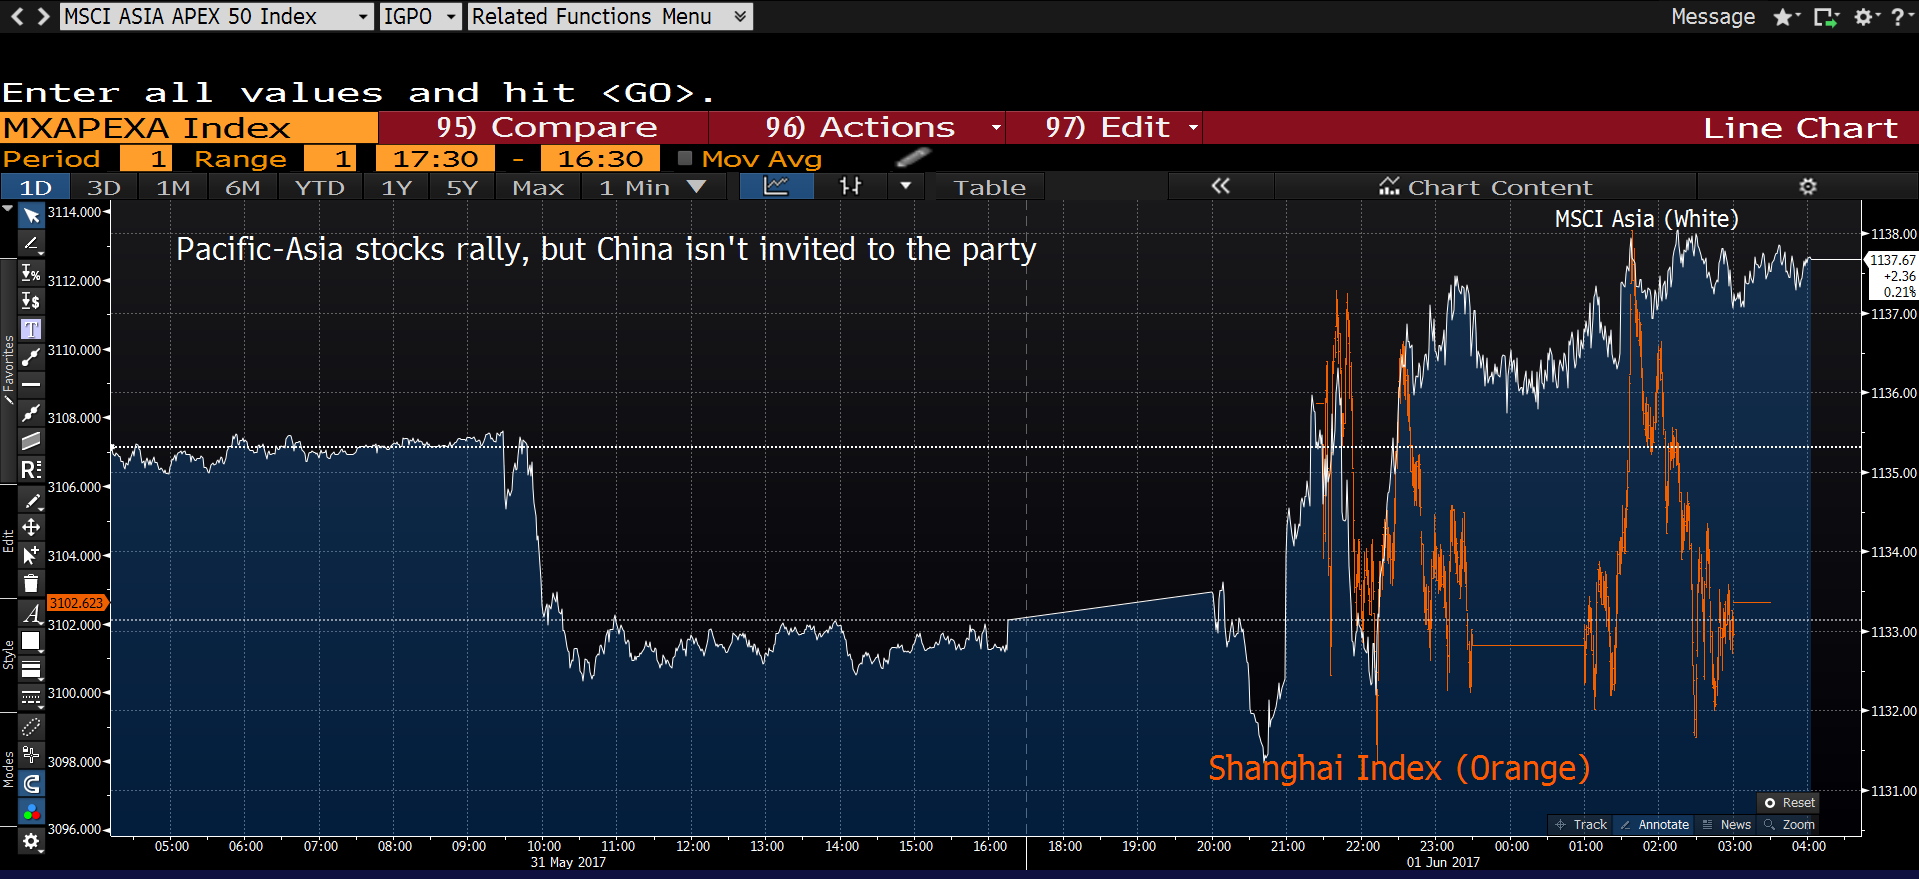
- The MSCI Asia Pacific Index increased 0.3 percent as of 2:29 p.m. in Tokyo. The gauge rallied 2.6 percent in May, gaining for a fifth month, the index's longest winning streak since 2013.
- The Shanghai Composite slipped 0.4 percent, after a four-day rally.
- Japan’s TOPIX rose 1 percent, after jumping 2.4 percent in May, its biggest monthly gain of the year.
- Singapore’s Straits Times Index climbed 0.4 percent.
- Sydney’s S&P/ASX 200 rose 0.1 percent after swinging between gains and losses amid economic releases from Australia and China.
- Hong Kong’s Hang Seng climbed 0.4 percent after completing its fifth straight monthly gain.
- Futures on the S&P 500 added 0.1 percent. The underlying gauge fell 0.1 percent Wednesday, trimming its May gain to 1.2 percent. It closed Friday at a record high.
Currencies
- The onshore yuan climbed 0.3 percent. The currency is up 1.4 percent over the latest four days, trading at the highest level since November.
- The yen slipped 0.2 percent to 111.01 per dollar, after gaining in the month of May. The Bloomberg Dollar Spot Index was little changed, following a 1.5 percent decline for May for the biggest monthly drop since January.
- The Australian dollar dropped 0.4 percent. The currency spiked after retail sales were stronger than expected, but reversed gains on China’s manufacturing data.
- The pound fell 0.2 percent to $1.2865. The latest Times/YouGov poll showed the Conservatives leading Labour by just three points. Election polling is sending jitters through the currency market.
Commodities
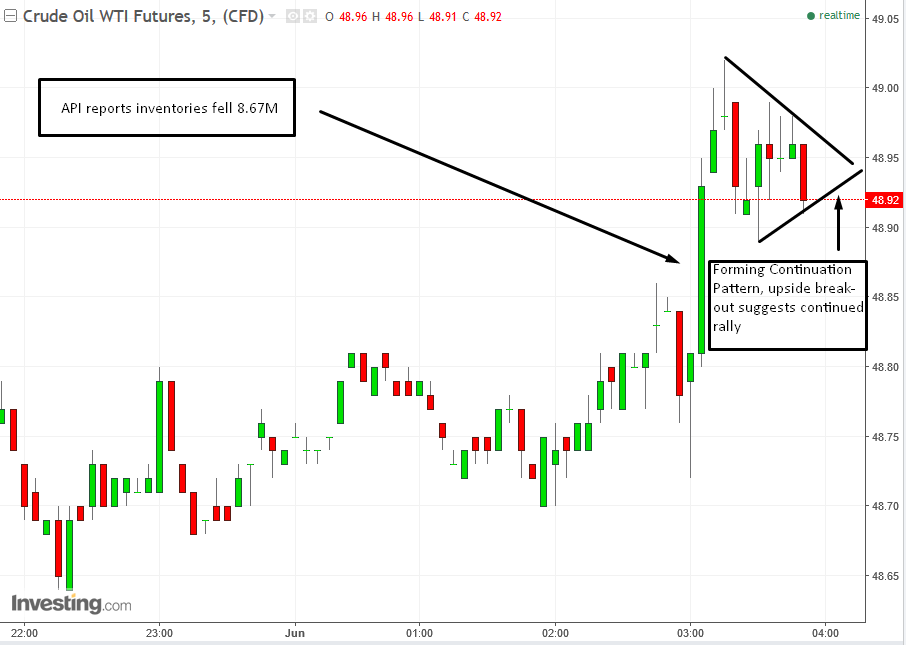
- West Texas Intermediate crude oil advanced 0.8 percent to $48.68 a barrel, rebounding from a 2.7 percent drop in the previous session.
- Gold dropped 0.2 percent to $1,266.70 an ounce, giving back some of Wednesday’s 0.5 percent gain.
Bonds
- The yield on 10-year Treasuries rose less than one basis point, to 2.21 percent after falling a similar amount on Wednesday.
- Benchmark yields in Australia dropped two basis points to 2.38 percent.
