Wednesday January 4: Five things the markets are talking about
Capital markets have left behind the December blues and quickly replaced it with a bout of volatility in the first couple of trading sessions of the New Year.
It will not be global fundamentals, geo-political issues or market technicals that will be driving the bulk of Q1 market volatility – the new U.S president’s elects twitter handle is expected to do most of the damage.
On day three of the New Year, the market remains cautiously optimistic; equity indices aspire to print new highs, the U.S dollar remains in vogue, while the continued backup in treasury yields supports investors expectations for higher U.S inflation and growth rate and hence, Fed rate hikes.
Expect the dollar to take its cue from today’s release of the FOMC minutes from the Fed’s Dec. 13-14 meeting at 02:00 pm EST.
A number of question may be answered this afternoon – the minutes could offer clues on the timing of rate increases this year (two, three, one), the extent to which the (Trump) fiscal outlook is affecting their projections, and their assessment of risks as inflation edges up and the U.S jobless rate dips.
1. Asia stocks start 2017 firm, Europe mixed
The global equity rally has extended into the New Year as data from the U.S, China and Europe continues to boost optimism for global growth. For now, the U.S fiscal ‘naysayers’ continue to take a back seat.
In APAC, Japanese stocks have kicked off 2017 sharply higher on a robust outlook and on a continued yen weakness (¥117.57).
Overnight, the Nikkei Stock Average ended up +2.5%, helped by gains in financial and export-oriented stocks, as trading resumed after a four-day holiday weekend.
Japan’s gains lifted other Asian markets as well with Singapore’s Straits Times Index up +1.1%, while Australia’s ASX 200 closed up +0.1%.
Elsewhere, in China, the Shanghai Composite Index closed up +0.7%, a new three-week high. While in Hong Kong, despite the broad buying in blue-chip stocks, the Hang Seng Index closed down -0.1% as many investors prefer to remain on the side lines to get a better understanding on the ‘new’ capital outflow restrictions on Chinese nationals.
In Europe, the main bourses are trading mixed. The Euro Stoxx 50 is again being supported by financials, while on the FTSE 100, homebuilders and pharmaceutical stocks are leading the gains.
U.S futures are set to open in the black (+0.2%)
Indices: Stoxx50 flat at 3,317, FTSE -0.1% at 7,171, DAX -0.2% at 11,566, CAC 40 flat at 4,899, IBEX 35 +0.1% at 9,500, FTSE MIB +0.1% at 19,588, SMI +0.3% at 8,340, S&P 500 Futures +0.2%

2. Crude gets a lift on inventory “guesstimates”
Crude oil prices have edged higher ahead of the U.S open on expectations that U.S. crude oil inventories are falling and on signs that oil producers are willing to stick to agreed output cuts that came into effect this week.
Consensus expects this week’s EIA report due tomorrow to show a drawdown of approximately -1.7m barrels w/w.
Note: On Nov 30th OPEC Ministers confirmed cutting output to +32.5M bpd, a six-month agreement that started on Jan 1.
Brent crude futures were up +49c at +$55.96 a barrel – yesterday the contract reached a fresh 18-month high, however, the strong dollar continues to put a temporary cap on prices.
U.S light crude (WTI) is trading at +$52.82 a barrel, up +49c from Tuesday’s close.
The biggest problem for investors will be the policing of OPEC and non-member production cuts.
Gold prices have edged up overnight as buoyant physical demand from major consumers China and India continue to offset the impact of a stronger USD.
Spot gold is up +0.3% at +$1,162.68, just shy of its three-week high print Tuesday (+$1,163.52).
Note: The bullion gained more than +8% in 2016, snapping three-years of declines.

3. Fixed income finds its reflation mojo
Yesterday saw another good U.S data point to hurt treasury bonds – U.S ISM manufacturing rose in December and beat economists’ forecast.
The report supported other upbeat releases Tuesday from China, Germany and the UK, which boosts the “reflation” trade after taking a break during the holiday season.
Currently, U.S. 10's are trading relatively stable after yesterday’s volatile session, which saw benchmark yields back up above +2.50% before settling roughly flat on the day at +2.450%.
Elsewhere, the 10-Year German bund inflation-related woes should subside after this morning’s release of the provisional Eurozone inflation number for December (see below). Higher-than-expected German inflation prints have reversed a large part of their end-2016 rally. The bund bid yield now stands at +0.27%.

4. The “Big” dollar dominates, until it does not
Yesterday, the ‘mighty’ U.S dollar index (DXY) was pushed to equal its 14-year high, boosted by positive data on factory activity – Tuesday’s ISM manufacturing index rallied to its highest level in two-years (54.7).
Ahead of the U.S open, the dollar trades atop of these highs, waiting to take its cues from this afternoon’s FOMC Dec minutes and Friday’s upcoming nonfarm payroll (NFP) data for clues of timing of more interest rate hikes. Current price action continues to be dominated by central bank credibility. The USD is being supported by the potential of three Fed hikes in 2017.
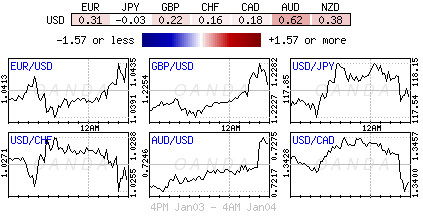
In contrast, the ECB is seen maintaining a ‘dovish’ tone despite the recent improvement in regional data and inflation (see below). The EUR is off its most recent 14-year lows and trading back above the psychological €1.04 handle on speculation that higher Euro inflation sets the stage for resumption of ECB QE Tapering debate.
USD/JPY is trading back below the ¥118.00 level after Japan’s Dec Final PMI Manufacturing confirmed its fourth consecutive month of expansion and highest reading in 12-months overnight (52.4).
Sterling(£1.2260) is little phased by the improvement in its Dec Construction PMI data earlier this morning.
Dealers are also speculating that the People’s Bank of China (PBoC) is asking state-owned banks and enterprises to buy the yuan to stabilize the currency, especially in the offshore market. The USD/CNH pair is down -0.6% at ¥6.9200 with the USD/CNY pair down -0.2% at ¥6.9445.

5. Eurozone composite PMI’s revised up, ditto for U.K construction
The composite Eurozone PMI for December was revised up to 54.4 from the flash estimate of 53.9, indicating that private sector activity grew at the fastest pace in five-years. The data adds to other indications that suggest the eurozone economy picked up in Q4.
There were also signs of a pick-up in inflation pressures, as costs rose at their fastest pace in more than five years, while businesses raised prices at the fastest pace since July 2011. Inflation in the euro area accelerated +1.1% in Dec.
Note: Better Euro area PMI’s and inflation data sets the stage for the resumption of the ECB QE tapering debate and why the EUR may be bid ahead of the U.S open.
In the U.K, construction PMI activity rose to 54.2 last month, its strongest print in nine-months, from 52.8 in November. Gains came as the industry saw the fastest rise in new order volumes in 12-months resulting in “sustained job creation and a broad-based upturn in business activity.”
Note: U.K cost pressures remain “intense” as suppliers passed on higher imported raw material prices, which posted their steepest rise in more than five-years.