Get 40% Off
👀 👁 🧿 All eyes on Biogen, up +4,56% after posting earnings. Our AI picked it in March 2024.
Which stocks will surge next?
Unlock AI-picked Stocks

Large Caps Fizzle, NASDAQ And Foreign Markets Sizzle

Published 03/29/2015, 12:14 AM
Updated 07/09/2023, 06:31 AM

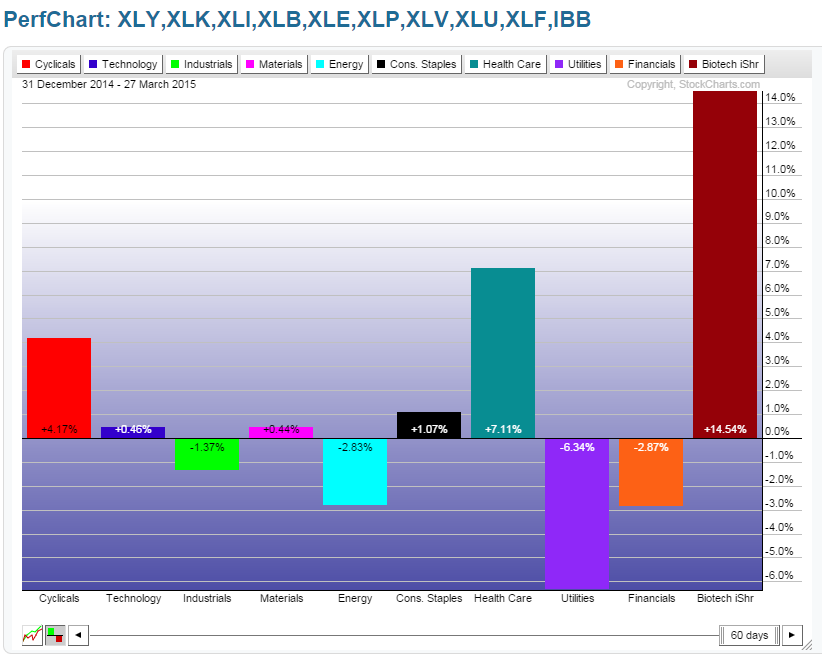
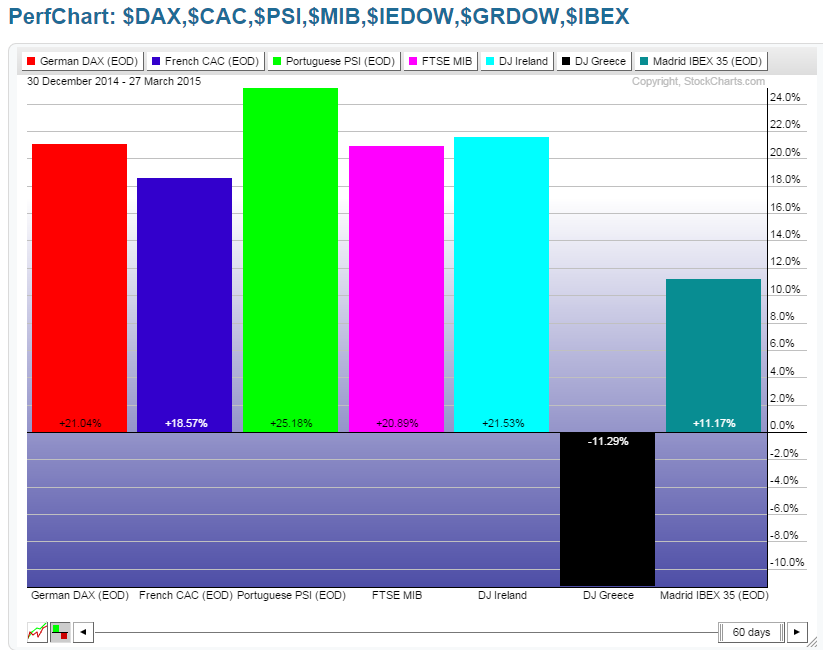
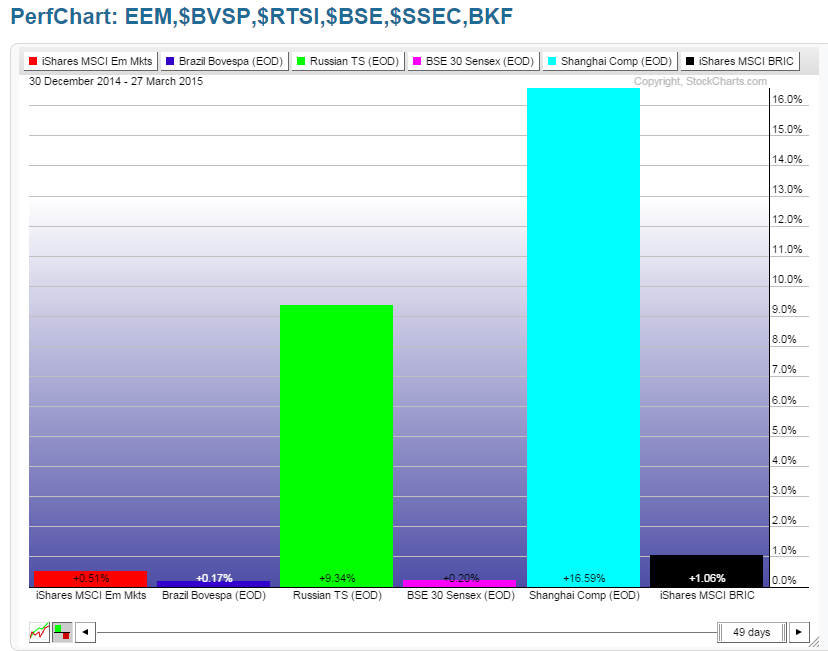
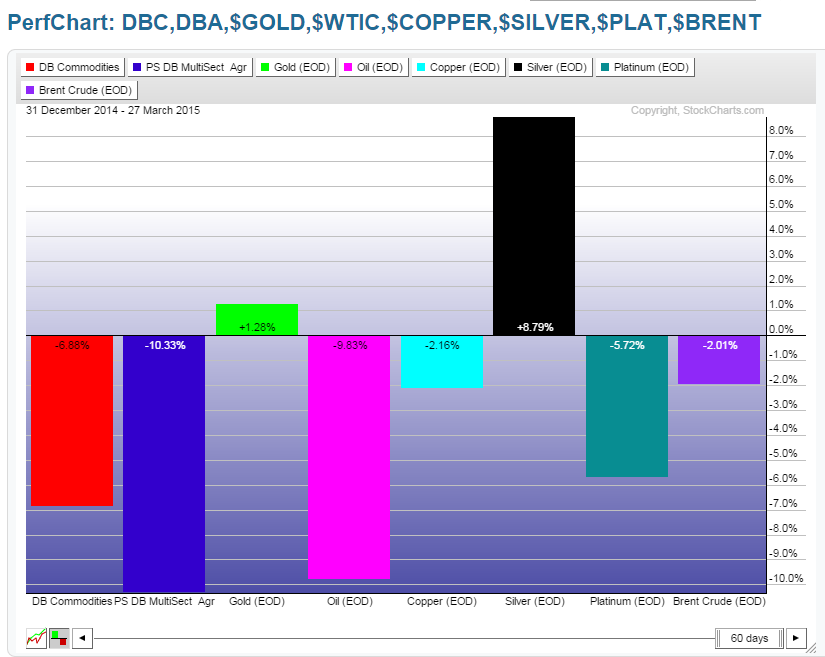
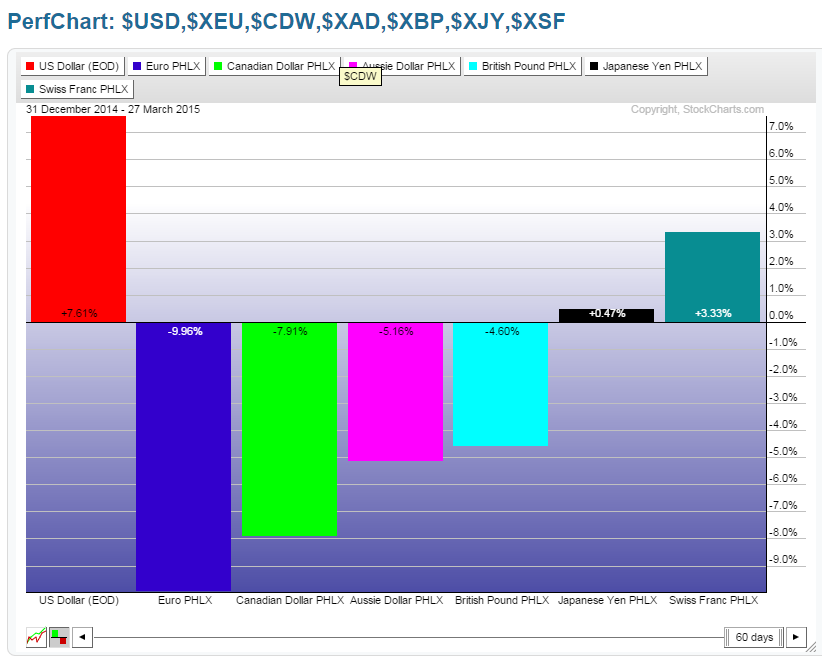
The following Year-to-Date Percentage Gained/Lost graphs are presented without individual comment to, simply, show where money has flowed in a variety of world markets since January of this year (until Friday's close).

This year, the majority of the money has flowed into the NASDAQ, Biotech), Homebuilders, Healthcare, the U.S. Dollar, U.S. Bonds, Silver, Russia, China, Japn, Australia, Germany, France, Portugal, Italy, Ireland, and Spain. The Dow 30, S&P 100, and S&P 500 Indices have remained basically flat, while Dow Utilities, Dow Transports, and Nasdaq Transports are down on the year, and Small Caps have made some minor gains.

U.S. MAJOR INDICES
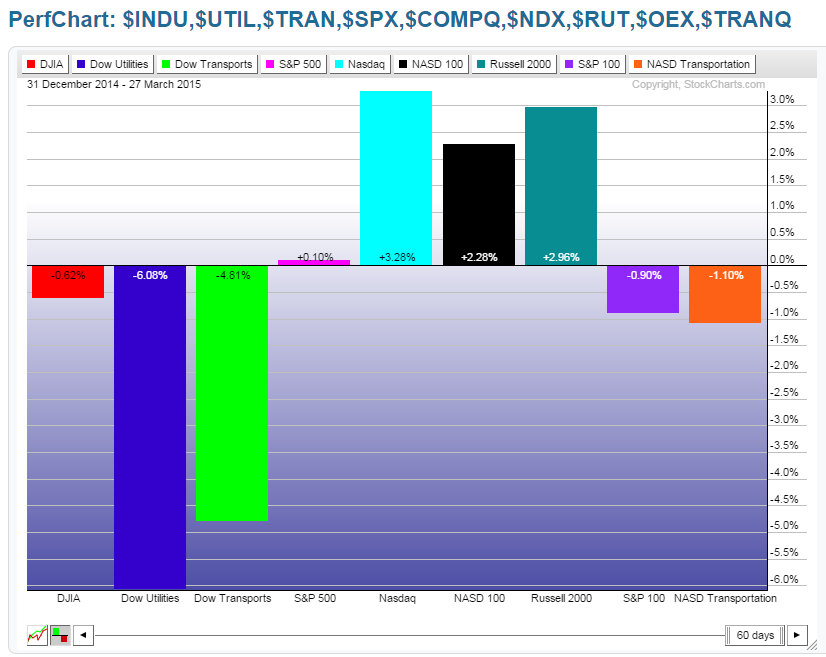
US Major Indices

U.S. MAJOR SECTORS + Biotech


US Major Sectors + Biotech

U.S. MAJOR SECTORS + Homebuilders
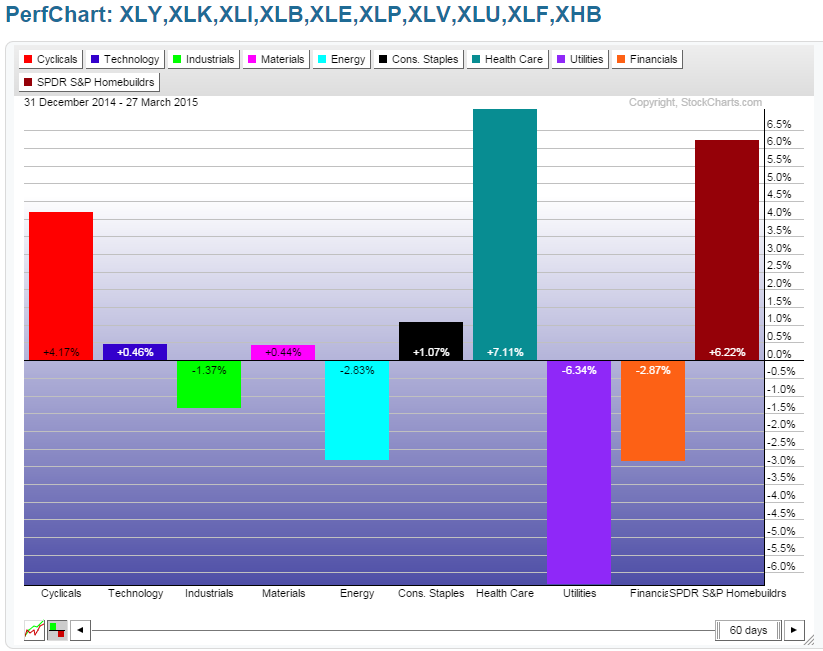

US Major Sectors +_Homebuilders

MAJOR EU COUNTRIES

Major EU Indices

EMERGING MARKETS + BRICs

Emerging Markets + BRICs

CANADA, JAPAN, BRITAIN, AUSTRALIA + MAJOR WORLD MARKET INDEX
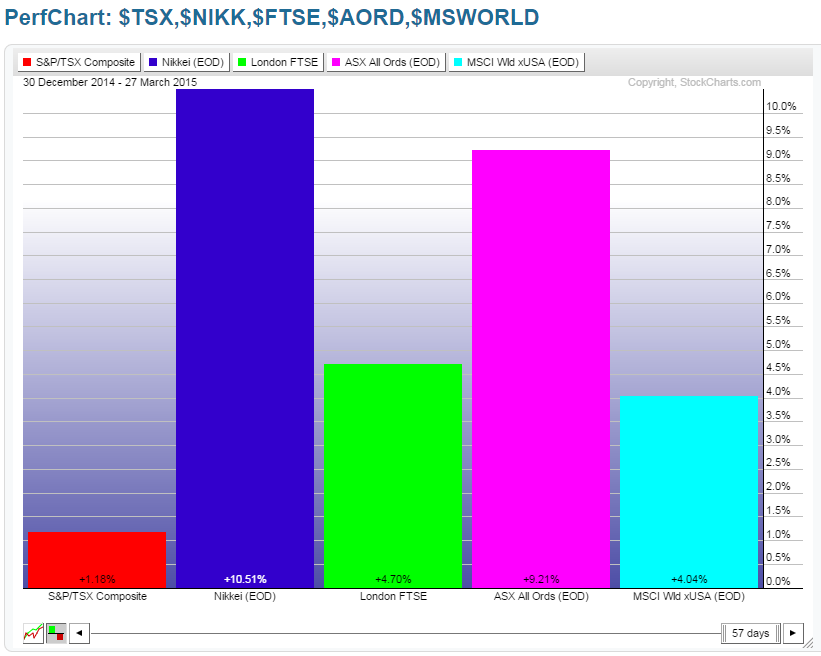
Canada, Japan, Britain, Austrialia +  MSCI World

COMMODITIES

Commodities

COMMODITIES + LUMBER + HOMEBUILDERS + USD + US BONDS
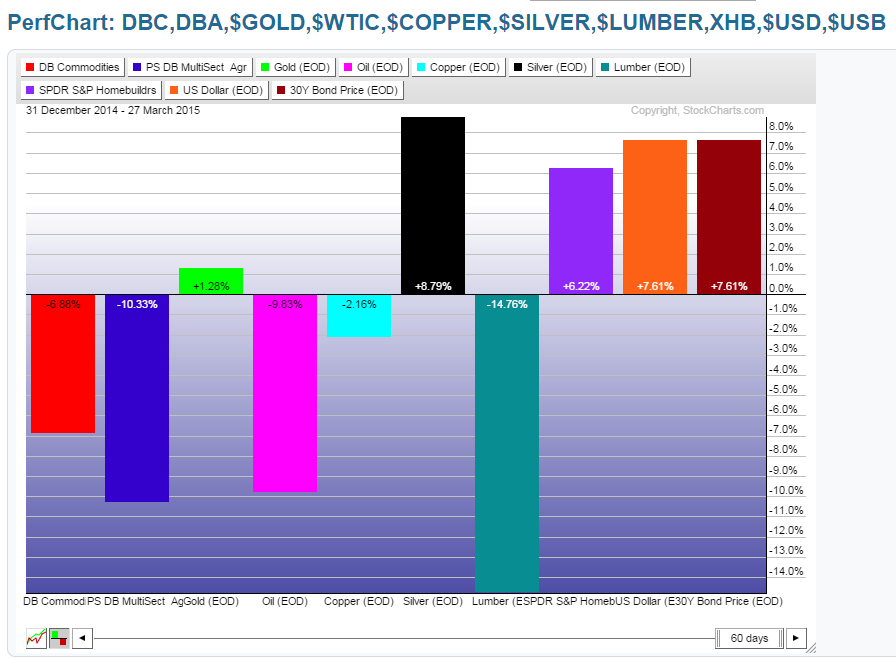
Commodities + Lumber + Homebuilders + USD + US Bonds

MAJOR CURRENCIES

Major Currencies
The following 1-Year percentage gained/lost chart shows the trend of the S&P 500 Index compared to the U.S. Dollar. They were, generally, in an uptrend until January of this year, whereupon the USD continued its gains, while the SPX consolidated in a large sideways range. From the beginning of March, the spread between them accelerated to the greatest extent seen over this one-year period, and they have been making some large volatile moves since then.

Whether this points to a capitulation and shift of money flow from the USD and into SPX (or whether we see a major correction in the SPX, with money flowing back into the USD) remains to be seen...it may be worth tracking the spread between these two to gauge such a shift in sentiment.
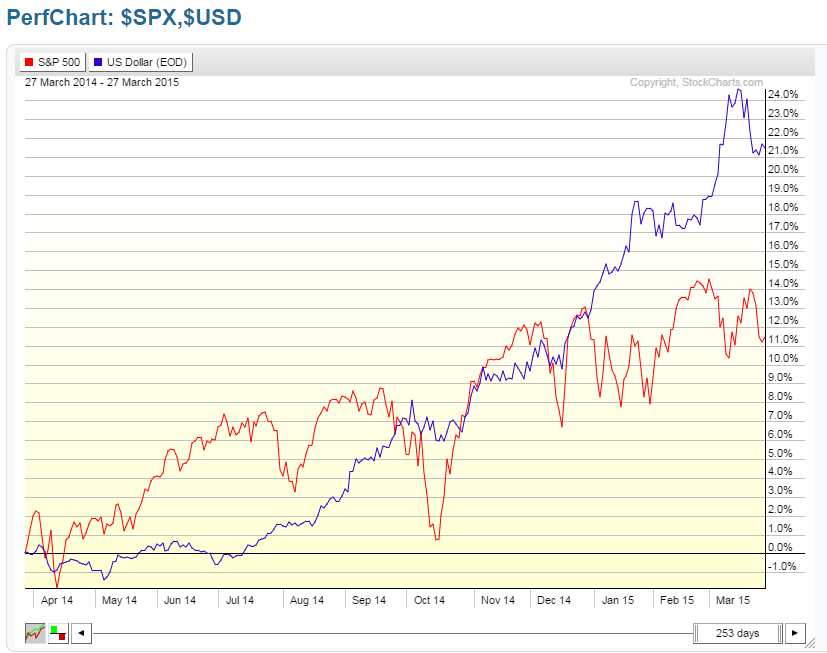
SPX vs USD 1-Y Chart
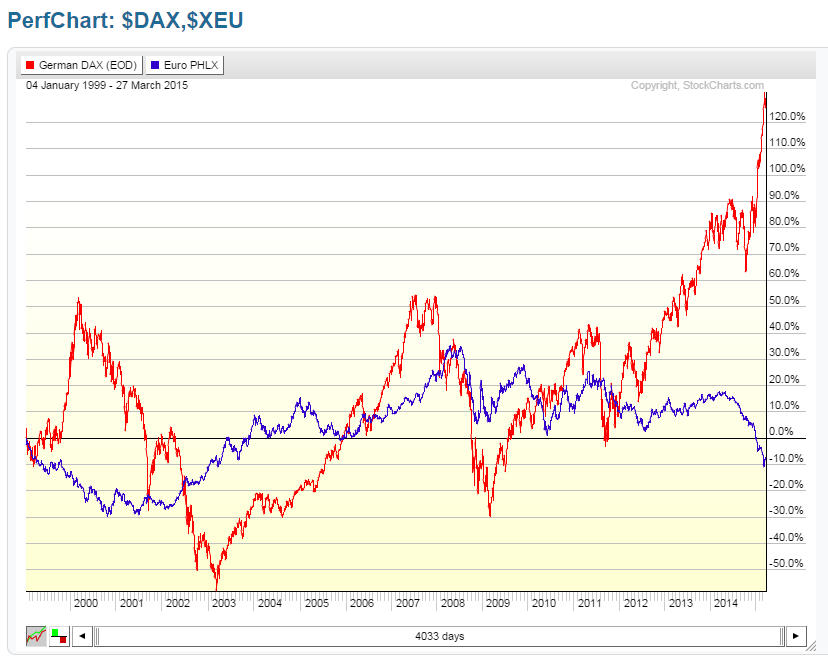
Furthermore, inasmuch as Europe has made such extensive gains so far this year (compared with U.S. markets), we'll see whether this pace continues, or whether some money is taken off the table soon. You can see on the following 1-Year percentage gained/lost chart that the spread between the German DAX and the Euro has reached an extreme level...in fact, the next chart, which begins in January 1999, shows this anomaly to be highly exaggerated and unprecedented.

The German DAX may, in fact, be well overdue for a major correction...another spread to watch closely over the near term.
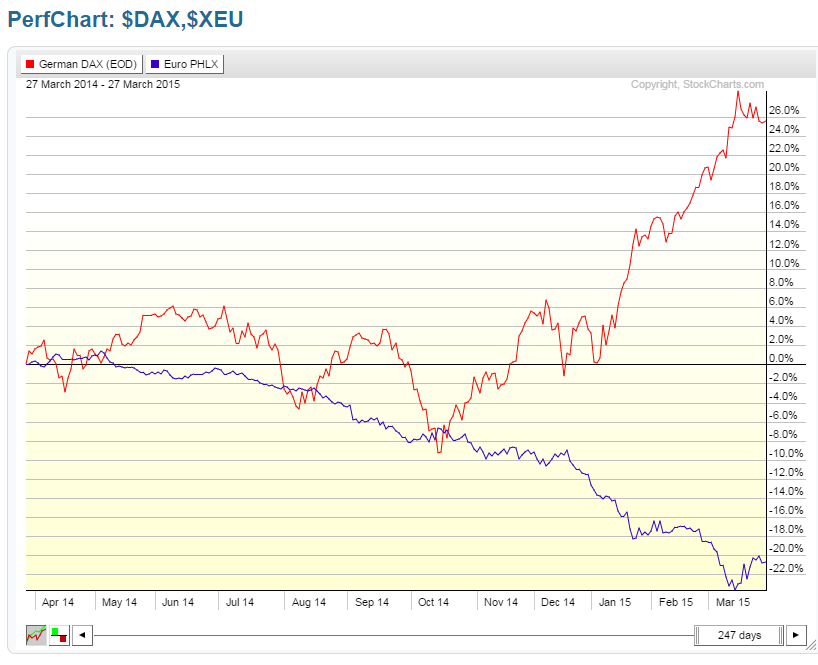
DAX vs Euro 1-Y Chart
DAX vs Euro 2000-Present

3rd party Ad. Not an offer or recommendation by Investing.com. See disclosure here or remove ads .

Latest comments

Risk Disclosure: Trading in financial instruments and/or cryptocurrencies involves high risks including the risk of losing some, or all, of your investment amount, and may not be suitable for all investors. Prices of cryptocurrencies are extremely volatile and may be affected by external factors such as financial, regulatory or political events. Trading on margin increases the financial risks.
Before deciding to trade in financial instrument or cryptocurrencies you should be fully informed of the risks and costs associated with trading the financial markets, carefully consider your investment objectives, level of experience, and risk appetite, and seek professional advice where needed.
Fusion Media would like to remind you that the data contained in this website is not necessarily real-time nor accurate. The data and prices on the website are not necessarily provided by any market or exchange, but may be provided by market makers, and so prices may not be accurate and may differ from the actual price at any given market, meaning prices are indicative and not appropriate for trading purposes. Fusion Media and any provider of the data contained in this website will not accept liability for any loss or damage as a result of your trading, or your reliance on the information contained within this website.
It is prohibited to use, store, reproduce, display, modify, transmit or distribute the data contained in this website without the explicit prior written permission of Fusion Media and/or the data provider. All intellectual property rights are reserved by the providers and/or the exchange providing the data contained in this website.
Fusion Media may be compensated by the advertisers that appear on the website, based on your interaction with the advertisements or advertisers.
© 2007-2024 - Fusion Media Limited. All Rights Reserved.