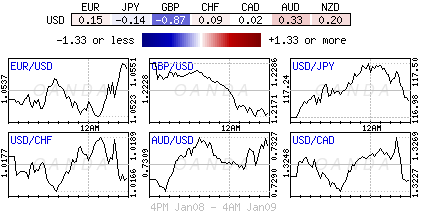
Monday January 9: Five things the markets are talking about
Last Friday’s U.S. December employment increased less than expected (+156k vs. +176k), but the markets interpretation in a rebound in wages (+0.4% m/m) suggests a sustained labor market momentum that sets up the domestic economy for stronger growth and further interest rate increases from the Fed in 2017.
Currently, fixed income dealers are trying to price in the possibility of three-rate hikes for this year.
There are a plethora of Fed speakers appearing this week, starting with a pair of regional Fed presidents speaking later today (Rosengren and Lockhart), and there are no less than five speeches lined up for Thursday and the main one being Fed Chair Yellen who appears at a webcast town hall meeting. By the end of this week the market is hoping to get a better understanding of the pace of U.S. interest rates.
In Europe, economic data this week will focus on industrial output and merchandise trade. In the U.K, with investors continuing to look for a ‘Brexit effect’, both industrial output and international trade data should offer further clues.
In Australasia, consumer and producer prices in China and India will be the focus of attention – to date, improving inflation data has been taken as a sign of stabilizing growth in China.
In the U.S, the main economic release of the week is not until Friday, when retail sales figures for December are out.
1. Equity Indexes reach for records
Asia’s biggest stock indexes finished broadly higher overnight, with Australia’s benchmark hitting a 19-month high, as major markets in the region caught a further bid from Friday’s North American gains.
The advance also follows strength last week in the region, where the Hang Seng saw its biggest weekly gain in three-months and the Shanghai Composite snapped a five-week losing streak.
The star overnight was the Aussie S&P/ASX 200 finishing +0.9% higher, supported mostly by financials and energy stocks. Elsewhere, the kiwi NZX-50 ended up +0.6%, Korea’s KOSPI finished down -0.34%, while Hong Kong’s Hang Seng rose +0.2% supported by gaming stocks as the market continues to reverse its pre-Christmas slide (Hang Seng is now up seven of the past eight sessions).
In China, the Shanghai Composite Index rose +0.5% after last week notching its first weekly gain since November.
Note: Japanese stocks will resume trading Tuesday after a national holiday on Monday.
In Europe, equity indices are trading generally lower despite a positive end to the Asian session. The FTSE 100 is notably outperforming led by commodity and mining stocks despite oil and copper prices trading sharply lower intraday. Financial stocks are again trading generally lower across the board.
U.S. equity futures are set to open little changed.
Indices: Stoxx50 -0.4% at 3,307, FTSE +0.2% at 7,226, DAX -0.4% at 11,556, CAC 40 -0.6% at 4,883, IBEX 35 -0.4% at 9,482, FTSE MIB -0.5% at 19,599, SMI -0.1% at 8,406, S&P 500 Futures flat.
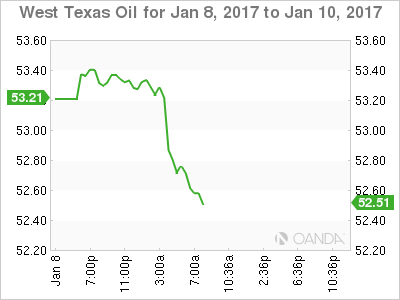
2. Oil prices start the week under pressure
Crude oil start the week under pressure as signs of growing U.S. production outweighs market optimism that many other producers, including Russia, were sticking to a deal to cut supplies in a bid to bolster the market.
Note: On Nov 30th OPEC Ministers confirmed cutting output to +32.5M bpd, a six-month agreement that started on Jan 1.
Another factor not helping energy prices is the resurgence of the “big” dollar on rate differentials after Friday’s non-farm payroll (NFP).
Brent futures are down -$1.01, or -1.8%, at +$56.09 a barrel, while U.S. crude futures (WTI) is trading at +$52.99 per barrel, down -$1, or -1.85% from Friday’s close.
The policing of production cuts will be the biggest concern for the energy market over the next six months.
With elevated energy prices, more U.S producers come back on line. Last weeks Baker Hughes report indicated that U.S. energy companies added oil rigs for a tenth consecutive week. This is expected to counterbalance OPEC and non-OPEC countries production cut efforts.
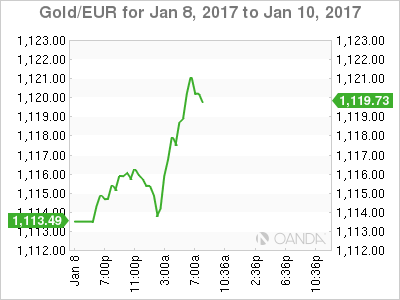
Gold prices (+$1,174 +0.1%) are little changed ahead of the U.S. open after Friday’s NFP strengthened the case for further interest rate hikes this year.
Spot gold rose nearly +2% last week, its biggest weekly percentage rise since early November.
3. Sovereign yields back up
Regional government-bond yields have remained under pressure since Friday’s upbeat U.S. economic data sparked a selloff in U.S. Treasuries.
U.S. benchmark 10-year yields backed up +8bps to +2.42% after Friday’s employment print and are little changed ahead of Monday’s U.S. open.
Elsewhere, Aussie debt sold off, with yields following the U.S. higher. The 10-year Aussie rate added +8bps to +2.76% percent, while its partner in crime; kiwi 10-years also rallied +7bps to +3.27%.
Short-term U.S rates will take their cues from a plethora of Fed speakers this week, starting with today’s two regional Fed president speakers – Rosengren (Boston) at 9:00 am EST, and Lockhart (Atlanta) at 12:40 EST.
4. Sterling battered, yuan bruised overnight
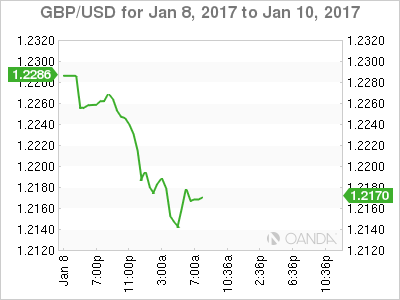
A “hard” Brexit scenario is back in play and this has pushed GBP to test multi-month lows against major pairs.
The pound overnight has slid more than -1% to a 10-week low outright of £1.2158, leaving it on course to target its late October low of £1.2083 after U.K. PM May’s comments on the weekend sparked fears of a “hard” Brexit, or losing E.U single market access. EUR/GBP has rallied more than +1% to a two month high of €0.8668.
The PM in a televised interview stated that the U.K. cannot keep “bits” of E.U membership and stressed the importance of immigration controls. The market has interpreted the comments as indicating that the U.K. would leave the single market when it leaves the E.U.
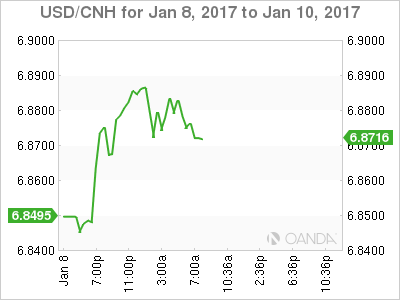
The offshore yuan retreated Monday against the dollar as both currencies recoup prior directions before late week’s jump for the Chinese unit. USD/CNH has rallied +0.4% overnight to ¥6.8770 after China’s forex reserves dropped -$41B last month to +$3.01T (see below).
Elsewhere, TRY continues to print new record lows outright with the pair moving beyond the $3.71 level this morning. Dealers continue to speculate whether the Turkey Central bank would defy government warnings of hiking interest rates.
Note: TRY is already down over -5% in the first week of the New Year.
5. China Reserve remain above the psychological threshold
China’s forex reserves fell for the sixth consecutive month, but continue to hover above the psychological +$3.0T barrier, though the decline of -$41B was slightly less than consensus drop of -$51B.
For 2016, the FX reserves have fallen -$320B – a smaller decline than record high -$513B in 2015. Speaking after the release, the People’s Bank of China (PBoC) adviser Fan Gang said the authorities intervention in curbing “outflows” has not been significant, and that longer term, the decline is a positive development desired by PBoC to be done smoothly. Fan added that China needs fewer reserves after the Yuan inclusion into the SDR basket, and also played down the worries about China’s financial system risks.
