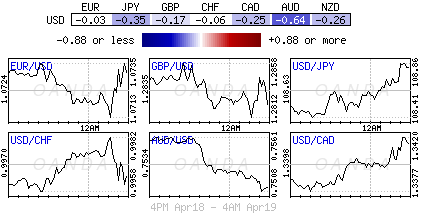
Wednesday April 19: Five things the markets are talking about
The pound is stable after yesterday’s surprise announcement by PM Theresa May to call a snap general election for June 8.
On Tuesday, sterling had its second-best day outright since last June’s Brexit vote, after PM May went back on repeated promises not to call a sudden election. The 2.4-cent rise in the pound since late Monday recovers a tenth of the loss since last years vote.
For sterling traders, the election does nothing at all to change the outcomes from the European side, where tough talk is still the order of the day.
The stakes for this Sunday’s French Presidential election vote are high, with two anti-EU and anti-EUR candidates among the four contenders (the far-right Le Pen, centrist independent Macron, center-right Fillon and far-left Melenchon).
Macron and far-right leader Marine Le Pen have lost steam in the run-up to this weekend’s vote, however, the pair are still expected to qualify for the May 7 run-off, with the centrist Macron winning that second-round according to this morning’s poll in the Le Monde newspaper.
In the second round, Le Pen is unlikely to significantly increase her support beyond her base and voters of the moderate left and right will amalgamate around Macron. Polls show him winning by margins of around +25% – this scenario will support Europe’s ‘single’ unit.
The standoff over North Korea’s nuclear weapons program continues to drag on.
1. Asian stocks slump as China selloff deepens, Europe mixed
In Japan, stocks traded relatively flat overnight as investors again refrained from taking large positions as geopolitical tensions continue to sour the mood.
The Nikkei 225 share average edged up +0.07%, while the broader Topix was down -0.01%.
In Hong Kong, stocks fell for the third straight session, following China equities lower as investors remain worried that Beijing’s stepped-up property curbs and deleveraging campaign will slow China’s economic growth. The Hang Seng index fell -0.4%, while the China Enterprise (CEI) lost -0.6%.
In China, the Shanghai Composite Index fell -0.8%, taking its four-day loss to -3.2%.
In Europe, equity indices are trading mixed as political uncertainty in France and the UK continues to weigh on the markets. Banking stocks are providing some support on the Eurostoxx, while commodity and mining stocks are trading notably higher in the FTSE 100.
U.S. equities are set to open in the black (+0.3%).
Indices: Stoxx50 flat at 3,420, FTSE -0.1% at 7,142, DAX +0.2% at 12,023, CAC 40 +0.2% at 5,000, IBEX 35 % +0.7at 10,334, FTSE MIB +1.2% at 19,677, SMI -0.3% at 8,503, S&P 500 Futures +0.3%
2. Oil prices stable on OPEC’s commitment, gold little changed
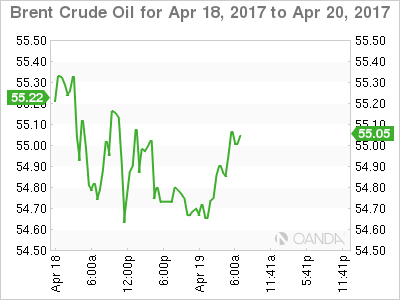
Oil prices are stable ahead of the U.S. open as OPEC said it was committed to draw down a global supply overhang that has been plaguing the markets for the past three-years. However, U.S. output and inventories still cap market prices.
Brent crude futures are unchanged at +$54.92 per barrel, while U.S. West Texas Intermediate (WTI) crude futures trade at +$52.43 a barrel.
OPEC’s secretary general said the group was “committed to restoring market stability by bringing global inventories down to the industry’s five-year average.” Also, a fall in shipments from the top exporter, the Saudi’s, is lending the market some support.
Capping prices is yesterday’s API data that showed that the U.S. market remains bloated. Despite crude inventories falling by -840k in the week to April 14 to +531.6m barrels, they still remain near record highs, while gas stocks rose by +1.4m barrels.
Expect the market to take their cue from today’s EIA report at 10:30 am EST.
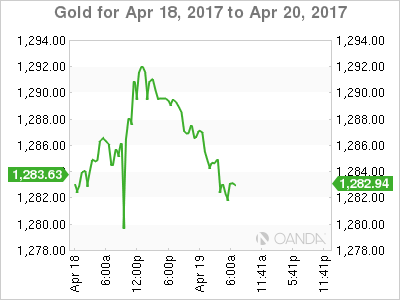
Gold has declined -0.4% to +$1,284.24 an ounce after closing at the highest since November in yesterday’s session. Geopolitical risks continue to provide support on pullbacks.
Iron ore has put the brakes on its recent plunge in prices, rising +2% overnight after losing -8% in the first two-days of this week.
3. Geopolitical concerns provide support for bonds
Long-dated German yields (+0.876%) are trading atop of their lowest levels for this year as investors’ continue to retreat to safe assets in the face of concerns over geopolitical tensions and the upcoming presidential election in France. The gap between French and German 10-year yields stands at around +73 bps – it has been trading in the low to mid-70s over the past week.
Note: In March, the yield on the German 30-year bond hit +1.29%, its highest in more than a year.
Elsewhere, the odds of the Fed raising interest rates in June have fallen to about +44% from more than +60% earlier this month as investors continue to question the strength of the U.S economy after weaker than expected data over the past week.
U.S. 10’s have backed up +3 bps to +2.20% after plummeting -8 bps yesterday.
Overnight, the yield on Japan’s benchmark 10-Year government note touched zero, while the Aussie 10-year yield (+2.46%) fell to its lowest since November.
4. Sterling drops, but more gains expected
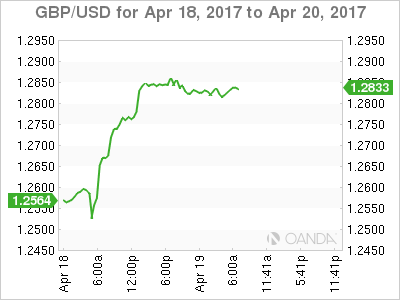
Sterling has eased a tad from its elevated levels, with GBP/USD last down -0.2% at £1.2815. The pound has managed to surge from levels below £1.26 on Tuesday morning, ahead of the U.S. open, after snap elections were announced for June.
Pound ‘bulls’ now expect more gains on the prospect of a hefty majority for PM May’s Conservative party. The techies are eyeing £1.3000 as their medium term target, however, it should not be a “straight line” with consolidation and selling expected after such a one directional move.
The U.K. parliament votes on the election later this morning, but this is seen as a formality.
5. Eurozone returns to a trade surplus
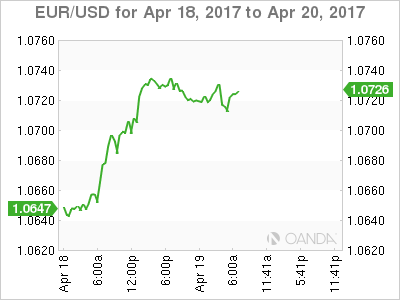
Data this morning shows that the eurozone’s trade balance with the rest of the world returned to surplus in February after January’s deficit print – a boost to hopes that E.U’s modest recovery gathered momentum in Q1.
The 19 countries that use the EUR exported -€170.3B of goods to countries outside the currency area, while importing goods valued at +€152.6B from the U.S., the U.K. and other economies, leaving a surplus of +€17.8B.
Note: In January, the eurozone ran a deficit of -€600M, the first such gap for three years.
Adjusting for seasonal effects, the eurozone’s exports rose by +0.4% from January, while imports were down -1.7%.
