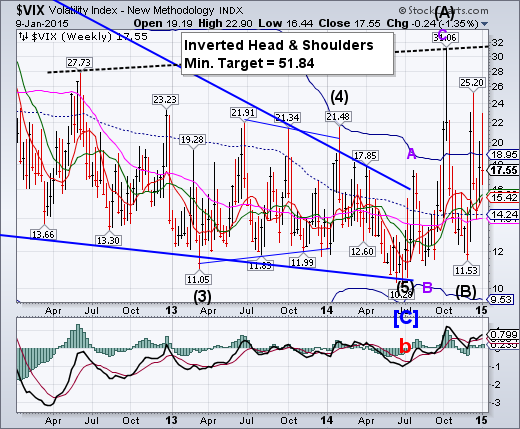
-- VIX rallied above Cycle Top resistance at 18.95, but completed its retracement beneath it.Next week should add to the excitement, as VIX is capable of exceeding its October high at 31.06.The Cycles Model suggests a probable rally top within a week. It may get very exciting.
SPX challenges Intermediate-term support.
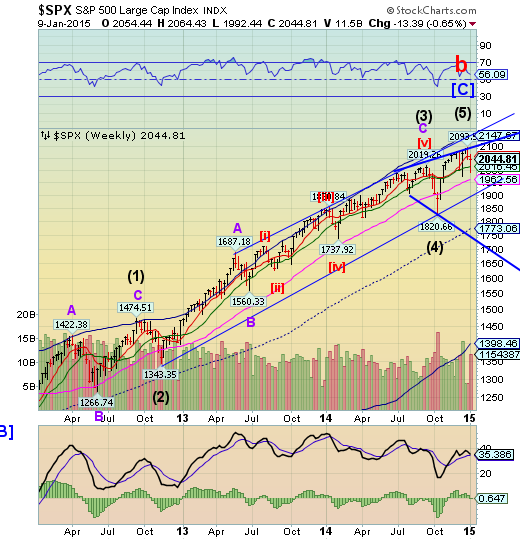
SPX challenged its Intermediate-term support at 2016.45 before retracing back to its Short-term resistance at 2060.68. It appears to be on schedule to complete the Orthodox Broadening Top pattern with Point 6 in its sights, beneath its lower trendline.The Cycles Model calls for another probable week or less of decline. The depth of the decline may give us some indication of what to expect during the rest of 2015.
(WSJ) Stocks declined on Friday, capping a rocky first full week of the year for investors, despite a stronger-than-expected jobs report that signaled continued health in the U.S. economy.
Many traders focused on an unexpectedly weak reading on wage growth, which somewhat offset the speedy clip at which employers added jobs last month. Still, investors said the data did little to shake their expectations that the Federal Reserve will remain patient with any increase in interest rates, widely expected later in the year.
The Dow Jones Industrial Average lost 170.50 points, or 1%, to 17737.37, while the S&P 500 declined 17.33 points, or 0.8%, to 2044.81. The Nasdaq Composite Index retreated 32.12 points, or 0.7%, to 4704.07.
NDX is also challenging Intermediate-term support.
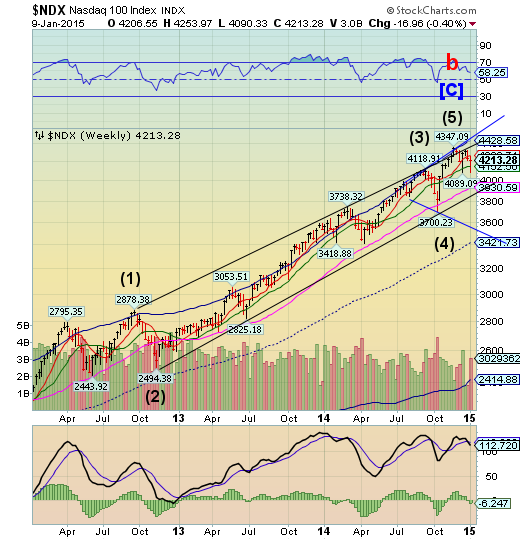
NDX challenged its weekly Intermediate-term support at 4152.50 before a two day retracement.A decline beneath the October 15 low at 3700.23 completes the Orthodox Broadening Top pattern and signals a major change in trend may be underway.
(OfTwoMinds) What will you accept as real--your intuition that something is deeply amiss in America, or the official propaganda that all is well?
In 1967, the rock group Buffalo Springfield recorded a song titled For What It's Worth which speaks not just to the late 1960s but to the present.
Consider the opening lines:
"There's something happening here, What it is ain't exactly clear."
High Yield challenges Long-term support.
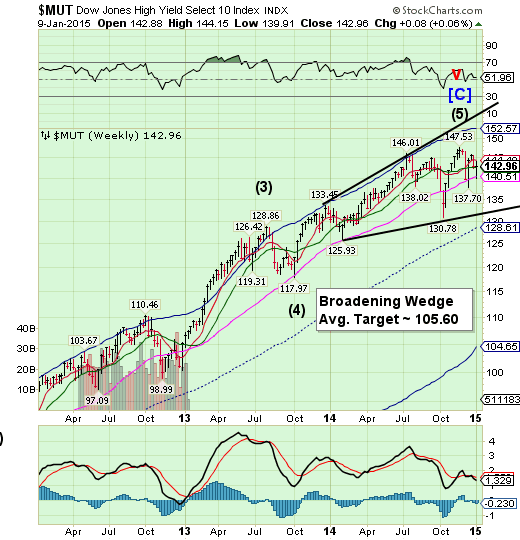
The High Yield Index challenged weekly-term support at 140.51 and closed just above its weekly Intermediate-term support at 142.66. A decline beneath weekly long-term support suggests a further challenge of mid-cycle support at 128.61 or even lower. Now is time to pay attention to the Broadening Wedge formation as well .A decline beneath the lower trendline puts MUT in motion toward its first target near its Cycle Bottom at 104.65. Will bond traders survive the next decline?
(ZeroHedge) While everyone is watching the absolute spread levels of high-yield bonds (or their prices or all-in yields) as the recognition of broad-based default risk (contagiously carried over from bloated and levered energy firms) arrives at the mainstream. However, under the surface of the arcane world of credit derivative indices is 'the basis' - which measures the difference between the index level being traded and the implied level of the index based on the individual components. In English, the basis measures the relative demand for macro risk protection... and it's at its highest since the chaos of Summer 2012...
The euro is in free-fall.
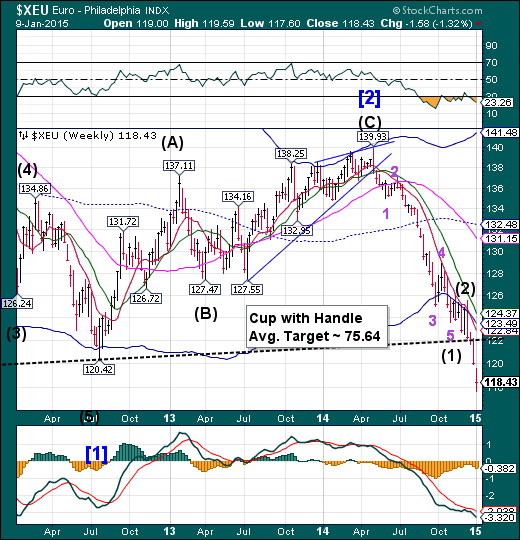
The euro left an open gap down on Monday, setting the bearish tone for the week. The euro may not expect its next Master Cycle low until early February, so it may fall quite a distance in the interim. With no supports, the euro is now in a panic decline. The next stop may be parity with the US dollar.
(BBC)The euro has hit a fresh nine-year low against the dollar, in part after a surprise decrease in German manufacturing.
German factory orders fell by 2.4% in November compared with the previous month, worse than expected.
The euro dropped below $1.176, before recovering slightly.
Analysts said increased speculation about extra stimulus measures to combat eurozone deflation also played a part in the euro's drop.
If the European Central Bank moves to support the region's economy with quantitative easing, or buying government bonds, as the speculation suggests, this pushes a rate rise even further into the future, making the eurozone less attractive for investors.
EuroStoxx challenges the lower trendline of the Broadening Wedge.
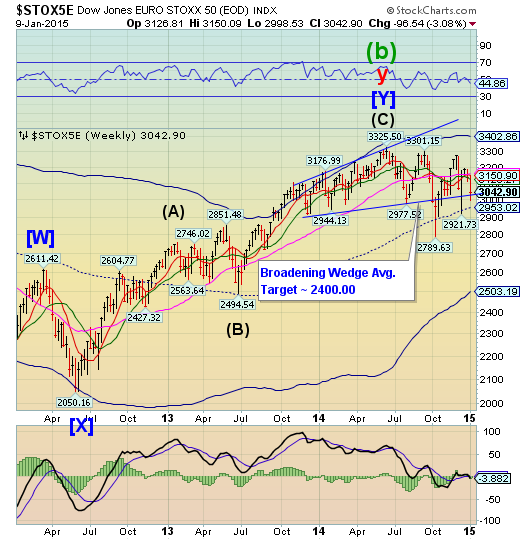
The EuroStoxx 50 Index declined through all near-term supports and challenged the lower trendline of its Broadening Wedge, closing just above it. After its retracement (which may be over), it is capable of declining through its mid-Cycle support at 2953.02 and achieving its Cycle Bottom at 2503.19.
(MarketWatch) — European stocks slid Friday, finishing the first full trading week of 2015 in the red, on mounting concerns that deflationary pressure will dampen global economic growth.
The STOXX Europe 600 SXXP, -1.29% lost 1.3% to end at 337.93, and hit intraday lows toward the end of the session as the pace of losses in U.S. equities SPX, -0.84% DIJA, -0.95% accelerated. Wall Street benchmarks moved lower after a mixed December jobs report from the U.S. The addition of 252,000 U.S. jobs was more than expected by analysts, but average hourly earnings fell for the first time since July 2013.
The yen closes above its Cycle Bottom support.
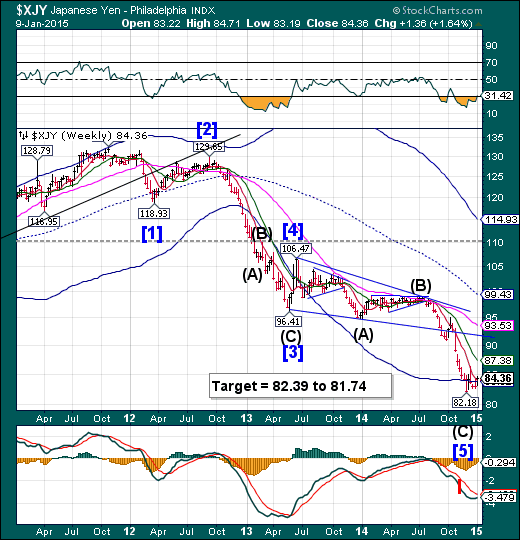
The yen made a weekly close above its weekly Cycle Bottom support at 83.9, also closing above its weekly Short-term support at 83.98. The month-long base-building suggests an explosive rally in the next week or so. This means a major source of stock market liquidity may be drying up.
(MarketPulse) Prime Minister Shinzo Abe’s Cabinet will endorse Friday a 3.12 trillion yen supplementary budget for fiscal 2014 to fund an economic stimulus package aimed at bolstering domestic demand curtailed by the April 1 consumption tax hike and weaker yen.
In an attempt to shore up flagging private spending, the government will allot 1.19 trillion yen to provide subsidies aimed at offsetting rising fuel costs and helping local governments implement measures necessary to revitalize their economies.
Abe’s administration mapped out the latest stimulus package worth around 3.5 trillion yen on Dec. 27. The extra budget is likely to be enacted during the ordinary Diet session to be convened later this month.
The Nikkei loses in the first week of the year.
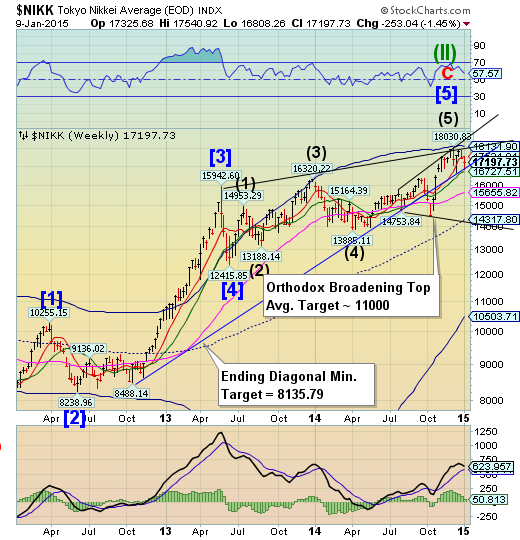
The Nikkei fell to the lower trendline of its Ending diagonal and Intermediate-term support at 16727.51 before a weak bounce. The Orthodox Broadening Top also plays a role in this reversal, representing a market that is out of control and has a highly emotional public participation. A loss of support of the Ending diagonal trendline at 17000.00 and Intermediate-term support may be the start of a dramatic decline that may last up to 3 months or longer.
(Reuters) - The Nikkei rose for a third day on Friday on growing confidence in the U.S. economy and hopes of aggressive stimulus steps in Europe, while Fast Retailing Co. Ltd. (TOKYO:9983) rose after reporting strong quarterly profits.
The Nikkei advanced 0.2 percent to end at 17,197.73 after dipping into negative territory earlier. For the week, it dropped 1.5 percent.
U.S. Dollar continues to extend.
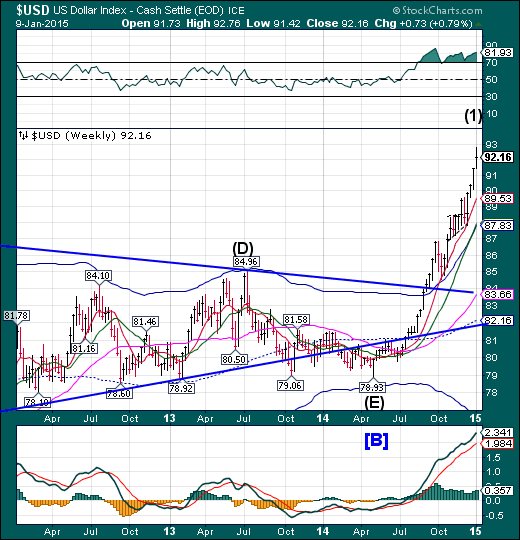
The US dollar continues to extend higher. It appears to have a near-term target near 94.80. The Cycles Model suggests that there may be a Primary Cycle high due between Tuesday and Thursday. A sharp retracement may follow, lasting approximately 3-4 weeks..
(CNBC) When it comes to the U.S. dollar, everyone seems to agree on two things: It will keep soaring, and everyone's too bullish.
The U.S. Dollar Index, which tracks the currency by comparing it to a basket of six currencies (though it is heavily weighted toward the euro) is up 15 percent in six months. In fact, the index has risen in 13 of the last 15 sessions, taking it to a nine-year high.
The impetus behind the move is clear. Firstly, the U.S. economy is greatly outperforming economies across the globe. And in turn, this means Federal Reserve policy will tighten even as other central banksare loosening. That would translate into higher short-term yields for those holding dollars, especially on a relative basis, thus making it more attractive to hold greenbacks.
USB continues to make new all-time highs.
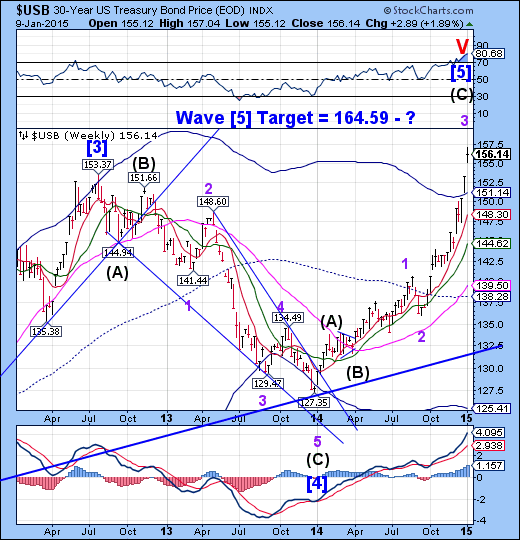
The Long Bond continues to gap higher on a daily and weekly basis. It is clearly in a parabolic blow-off that may not end well. It is due very soon for a 2-3 week correction starting next week, but may continue higher for several months following it.
(ZeroHedge) Few will ever forget the ferocity of the October short-squeeze in US Treasuries that flash-crashed yields. As Nanex notes however, today's yield plunge (price surge) is starting to shape up as an extreme flight-to-safety squeeze. As we noted earlier, US Treasury short positioning into this week was its highest in over 4 years...
(ChicagoTribune) Investors in the United States seem fixated on a gloomy outlook for 2015, in which the Federal Reserve's efforts to remove economic stimulus cause stock and bond prices to fall. They're missing an important detail: If the Fed raises short- term interest rates above those in other major economies, U.S. markets may actually benefit.
Investors have displayed a frantic aversion to signals that a long period of near-zero U.S. interest rates is coming to an end. In the two weeks prior to the Fed's Dec. 17 policy meeting, theS&P 500 tumbled more than 5 percent amid concerns that improved economic data would prompt the central bank to raise its short-term interest-rate target sooner. When the Fed issued a statement that suggested it was willing to wait, stocks rebounded to a series of all-time highs.
Gold rallies through resistance.
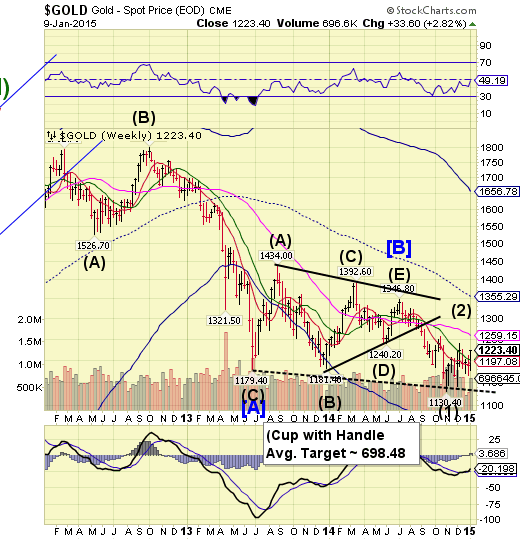
Gold rallied through Intermediate-term resistance at 1202.76 and appears to be capable of further elevation as far as weekly Long-term resistance at 1259.15. This may be no more than a retracement, since gold has a Primary Cycle Pivot due on Tuesday. There has been a lack of clarity in gold over the past few months. Should it turn down next week, clarity may return.
(CNBC) Gold rose on Friday as the dollar and equities failed to react to a better-than-forecast U.S. jobs report, and the metal was set for the first weekly gain in four weeks as political uncertainty in Greece boosted demand for assets seen as safe.
The U.S. economy created 252,000 jobs in December, while the unemployment rate dropped to 5.6 percent. Economists had seen job growth at 240,000, with a jobless rate of 5.7 percent.
Spot gold rose to a session high of $1,221.30 an ounce in the wake of the report, not far from a three-week peak of $1,222.40 hit on Tuesday.
Crude continues its decline.
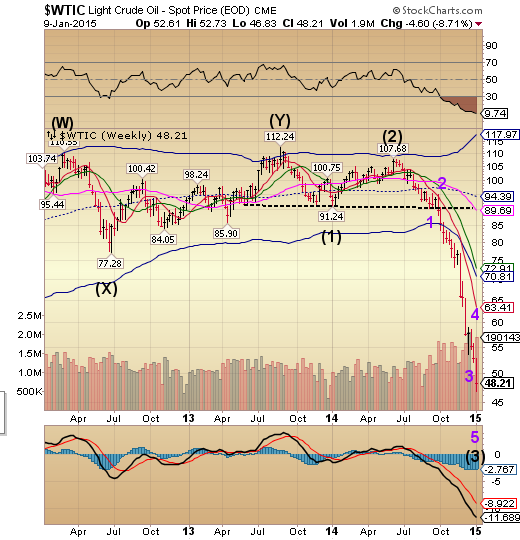
Crude tested its 46-handle, this week, making an intra-day low of 46.83. The decline has continued beyond the exhaustion point for many traders, but persistently new lows are being made, nonetheless.The Cycles Model calls for a bottom in the coming week. $43.00 oil, anyone? That appears to be the final target.
(Fortune) More oil rigs went idle last week than any week in more than two decades. With a global supply glut sending prices for crude plummeting, U.S. oil drillers are pulling up stakes as if fleeing a blown out well.
The number of active oil rigs in the U.S. fell by 61, to 1,750, last week, according to the latest rig countfrom oilfield services company Baker Hughes. It was the largest weekly decline since February 1991 and it comes after more than six months of steadily declining oil prices.
China made its weekly high and low within 24 hours.
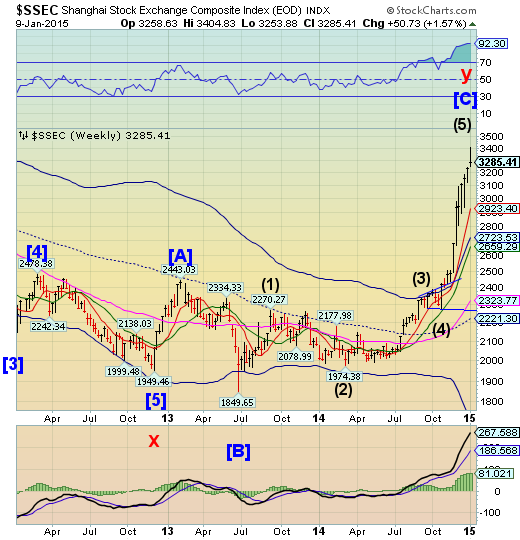
The Shanghai Index continued to step higher until Thursday, only to suffer a strong reversal today. I had suggested last week that the reversal might come between Monday and Wednesday. The high was made a day later than forecast. A key reversal was made, as well. We will look for follow-through early next week.
(Bloomberg) Chinese stocks in Shanghai are poised for a temporary retreat after their valuation premium over Hong Kong-traded counterparts surged to a more than five-year high, according to Janney Montgomery Scott LLC.
The Shanghai Composite Index, comprised mainly of yuan-denominated A shares, is valued at about 12 times estimated earnings after surging 34 percent in the past two months. That’s 54 percent more expensive than the Hang Seng China Enterprises Index of mainland companies listed in Hong Kong and close to the widest gap since July 2009, according to data compiled by Bloomberg.
The Banking Index shows profound weakness.
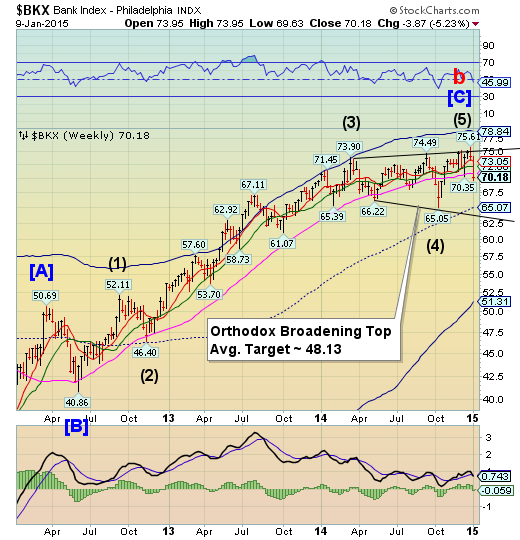
--BKX declined beneath its weekly Long-term support at 70.96 and its December 17 low at 70.35. BKX now must decline beneaththe lower trendline of its Orthodox Broadening Top at 63.00 to complete point 6 of the formation. The Cycles Model suggests a significant low may be made between Tuesday and Thursday this coming week.
(WSJ) Citigroup Inc. (NYSE:C) and Bank of America Corporation (NYSE:BAC) have cut the pools of bonus money set aside for traders and other employees, as Wall Street scrambles to adjust its expenses following a surprisingly weak December.
Choppy markets appear to have caught some bank trading desks flat-footed, wiping out gains they had accumulated earlier in the fourth quarter, traders and analysts said. Although not all big banks were hit with the holiday blues this past month, the late adjustments reflect the volatility in the results of the firms’ securities divisions, and how traders’ full-year performance can be cinched—or come undone—in a few frenzied weeks.
(ZeroHedge) Earlier today, when we were conducting a routine check with the Office of the Currency Comptroller's on the total notional amount of derivatives held at the Big 4 banks in the context of the "JPMorgan break up" story, we found something stunning: using the latest, just released Q3 OCC data, JPMorgan is no longer America's undisputed derivatives king. Well, it still is at the HoldCo level, where it is number one in terms of notional derivatives with $65.5 trillion, but when one steps a level lower, namely the FDIC-insured commercial bank (the National Association or N.A.) level, something quite disturbing emerges.
(ZeroHedge) All is clearly not well below the surface. Europe's largest bank (by market value) has admitted in a regulatory filing that it needs to raise capital. As WSJ reports, Banco Santander (MADRID:SAN) SA said it would raise up to €7.5 billion ($8.88 billion) in a capital hike, a bid to address long-running concerns among investors and analysts that its financial cushion was weaker than peers. European banking stocks are up over 2% today as Italian banks surge limit up (BMPS +13%) on speculation that they will be purchased by Santander (who 'pumpers' believe are raising this capital to go on a spending spree) and 'old' Draghi headlines.
(CNNMoney) Citigroup traders got bad news this week -- their coveted bonus checks are going to be smaller this year.
