
Most major EU and US indices gained yesterday, while the US dollar fell against all the other G10 currencies, despite US inflation surging to +2.6% yoy. It seems that market participants eventually trusted the Fed that any spikes in inflation this year are likely to prove to be temporary. Overnight, we also had an RBNZ decision, with the Bank standing pat and the Kiwi barely reacting as the outcome may have been the one mostly expected.
US Inflation Accelerates But Also Falls, NZD Unphased By The RBNZ
The US dollar traded lower against all the other G10 currencies on Tuesday and during the Asian session Wednesday. It underperformed the most against NZD, SEK, and AUD in that order, while it lost the least ground versus GBP and CAD.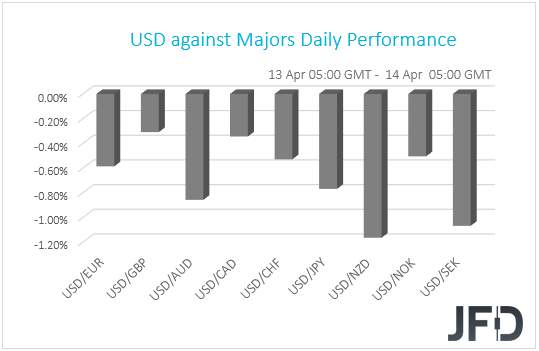
The weakening of the US dollar, combined with the strengthening of the risk-linked Aussie and Kiwi, suggests that markets traded in a risk-on fashion yesterday and today in Asia. Indeed, turning our gaze to the equity world, we see that most major EU and US indices traded in positive waters, with the exceptions being Spain’s IBEX 35 and the Dow Jones. The upbeat appetite rolled over into the Asian session today as well. Although Nikkei 225 slid 0.44%, China’s Shanghai Composite and Hong Kong’s Hang Seng gained 0.52% and 1.34% respectively.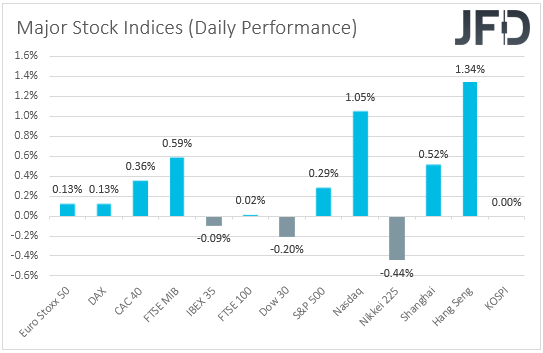
Yesterday, the main economic release was the US CPIs for March. The headline rate jumped to +2.6% yoy from +1.7%, while the core one rose to +1.6% yoy from +1.3%. The US dollar spiked higher at the time of the release, but it was quick to give back those gains and to continue to trade lower throughout the rest of the day. This may have been the case due to market participants eventually believing the Fed’s view that any spikes in inflation this year are likely to prove to be temporary and that it is too early to start discussing policy normalization. As we noted several times recently, this is likely to keep the US dollar under selling interest, while it may allow equities to continue trending north.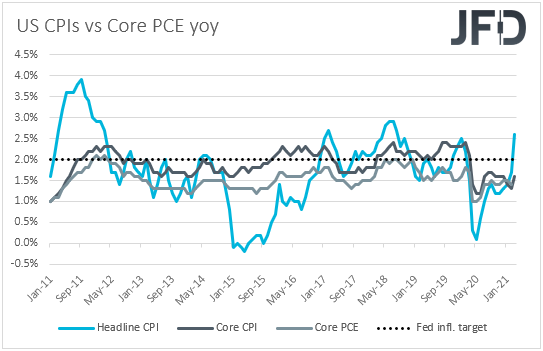
As for today, during the Asian session, we had an RBNZ monetary policy decision, with policymakers keeping their policy settings untouched. In the statement accompanying the decision, officials maintained the position that they remain prepared to lower the OCR further if required, while noting that a prolonged period of time is most likely to pass before their objectives are met. The Kiwi barely reacted at the time of the release, perhaps because this is the outcome most market participants may have been expecting, and continued to march north driven by the improvement in the broader market sentiment.
AUD/USD Technical Outlook
This morning, AUD/USD popped above the 200 EMA and above the previous highest point of April, at 0.7676, this way showing willingness to move higher. At the same time, the pair is balancing above a short-term tentative upside support line taken from the low of Apr. 1. If the rate continues to trade above that 0.7676 hurdle, this may continue attracting buyers into the game. For now, we will take a positive approach.
Given the break above the 0.7676 hurdle, more buyers could join in and drive the rate higher. AUD/USD may even overcome the 0.7700 obstacle and target the 0.7756 zone, marked by the high of Mar. 22. If the buying doesn’t stop there, the next possible aim might be at 0.7772, which marks the high of Mar. 19.
Alternatively, to consider a downmove, a break of the aforementioned upside line and a rate-drop below the 0.7585 area, marked by yesterday’s low, would be needed. AUD/USD could then slide to the current lowest point of April, where the pair might stall temporarily. That said, if the bears are still feeling active, they may send the rate further south, where the next target could be at 0.7461, marked by the low of Dec. 21, 2020.
NZD/CAD Technical Outlook
Looking at NZD/CAD on our 4-hour chart, we can see that at the end of March, the pair found support near the 0.8747 hurdle, and then reversed higher. The rate is now balancing above a short-term tentative upside support line taken from the low of Apr. 1. This morning, the pair is testing one of its key resistance barriers, at 0.8888, marked near the highs of Apr. 7 and 8. If NZD/CAD has a strong push through that barrier, we will get even more comfortable with higher areas.
If that move happens, more buyers could join in and drive the rate further north. We will then target the 200 EMA, together with the 0.8926 zone, marked by the low of Mar. 17, where NZD/CAD might temporarily get halted. The pair may even retrace back down, however, if it stays above that 0.8888 area, new buyers might join in. If this time the bulls are able to overcome the 0.8926 obstacle, the next potential target could be at 0.8995, which is marked by the high of Mar. 22.
On the other hand, if the rate suddenly falls below the aforementioned upside line and also falls below the 0.8822 zone, marked by yesterday’s intraday swing low, that may spook new buyers from entering for a while. NZD/CAD could then slide to the 0.8804 obstacle, or to the 0.8775 hurdle, marked by an intraday swing high of Apr. 1. If the selling continues, the next possible target might be at 0.8747, which is the lowest point of March.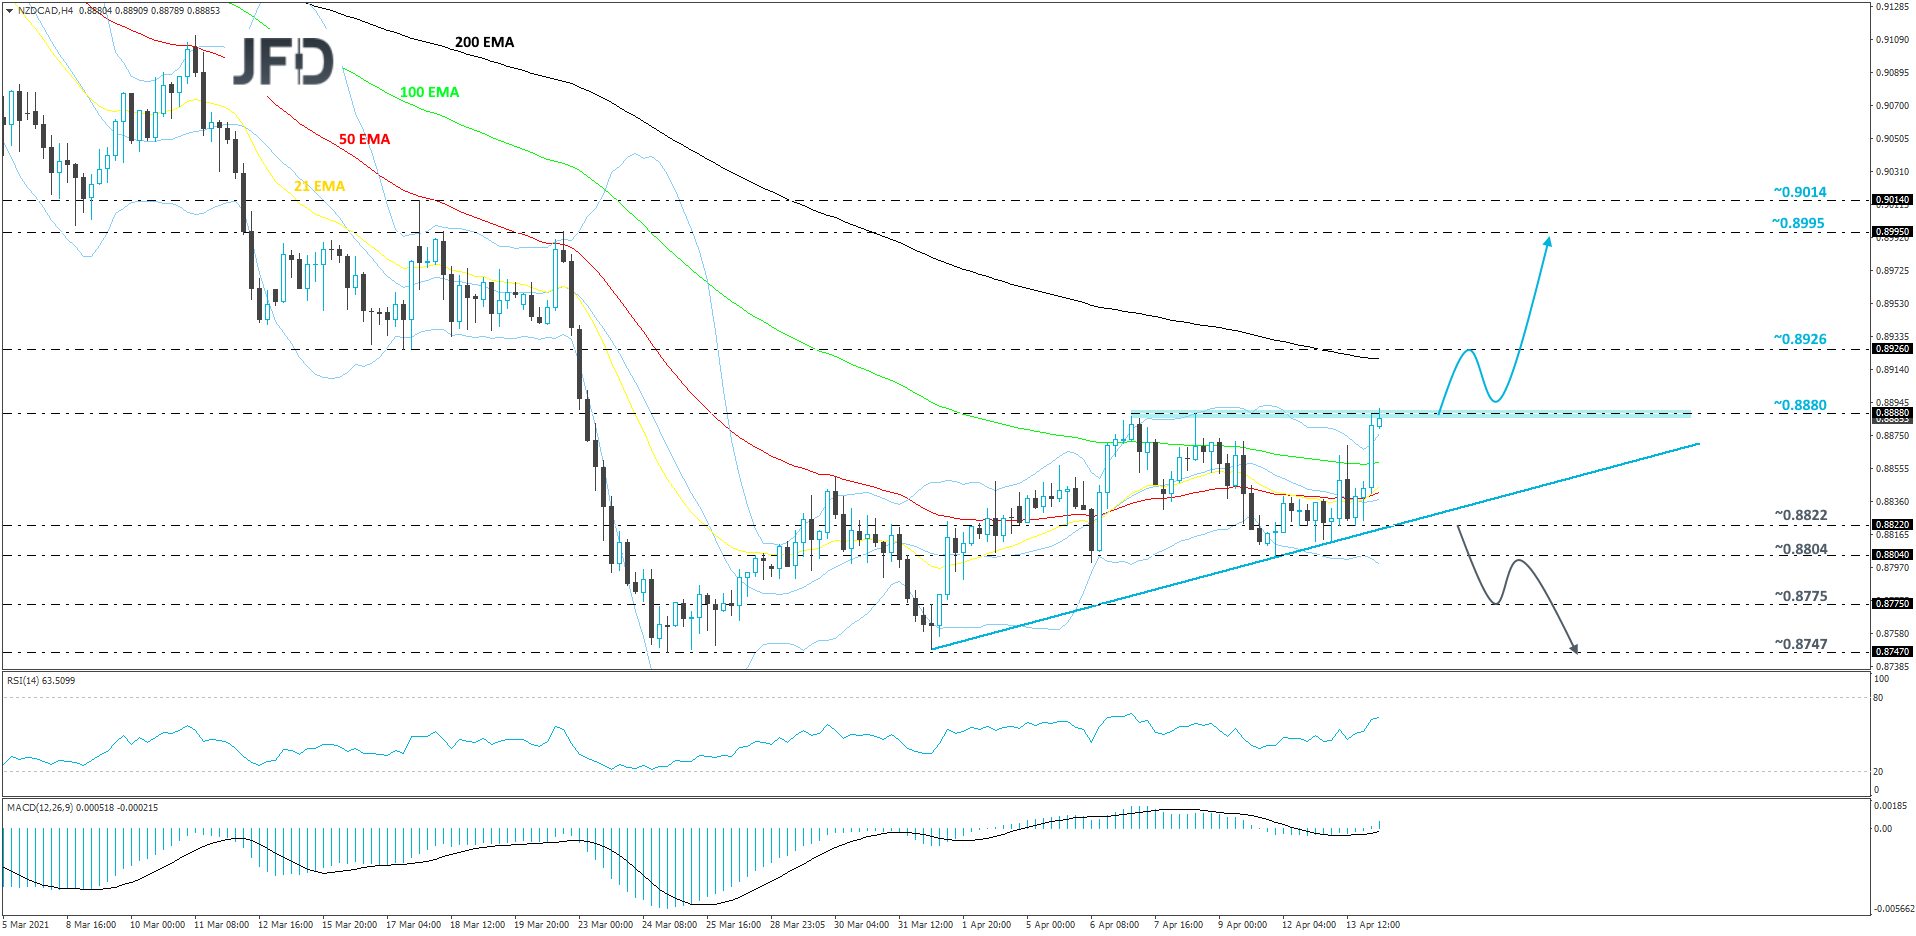
As For The Rest Of Today's Events
During the European session, we have Eurozone’s industrial production for February, which is expected to have contracted 1.1% mom, after expanding 0.8% in January. Later in the day, from the US, the EIA (Energy Information Administration) report on crude oil inventories for last week is coming out and the forecast points to a 2.889mn barrels decline following a 3.522mn slide the week before.
As for tonight, during the Asian session Thursday, we get Australia’s employment report for March. The unemployment rate is forecast to have ticked down to 5.7% from 5.8%, while the net change in employment is forecast to show that the economy has gained 35.0k jobs, after adding 88.7k in February. A slowdown following February’s strong jobs growth appears more than normal to us, and thus, we would consider this to be a decent report.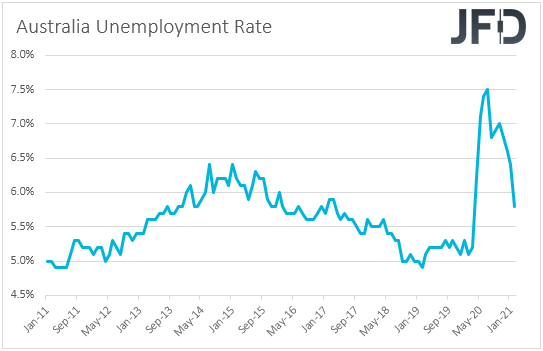
At this month’s gathering, the RBA kept its policy unchanged, repeating that the economic recovery in Australia is well underway and that it is stronger than had been expected. Therefore, a decent employment report would add credence to that view and may diminish even further the chances for this Bank to ease policy further in the foreseeable future. This is likely to prove positive for the Australian dollar.
We also have eight speakers on today’s agenda and those are: ECB President Christine Lagarde, ECB Executive Board member Fabio Panetta, ECB Executive Board member Isabel Schnabel, BoE MPC member Jonathan Haskel, Fed Chair Jerome Powell, Fed Vice Chair Richard Clarida, New York Fed President John Williams, and Atlanta Fed President Raphael Bostic.