by Eli Wright
Global markets have mostly been trading sideways during the second half of December as a holiday induced calm descended on markets. With many exchanges still closed today for Christmas/Boxing Day, the trend should extend into New Year celebrations at the beginning of next week. Markets in Australia, New Zealand, Canada, Britain, and Hong Kong are all closed.
Asia-Pacific shares have been the most active over the past two weeks, trading within a three percent range – and dropping lower to end last week, as indicated in the chart below comparing the Dow, S&P 500, NASDAQ Composite, MSCI Europe and FTSE Asia Pacific indexes over the past two months.
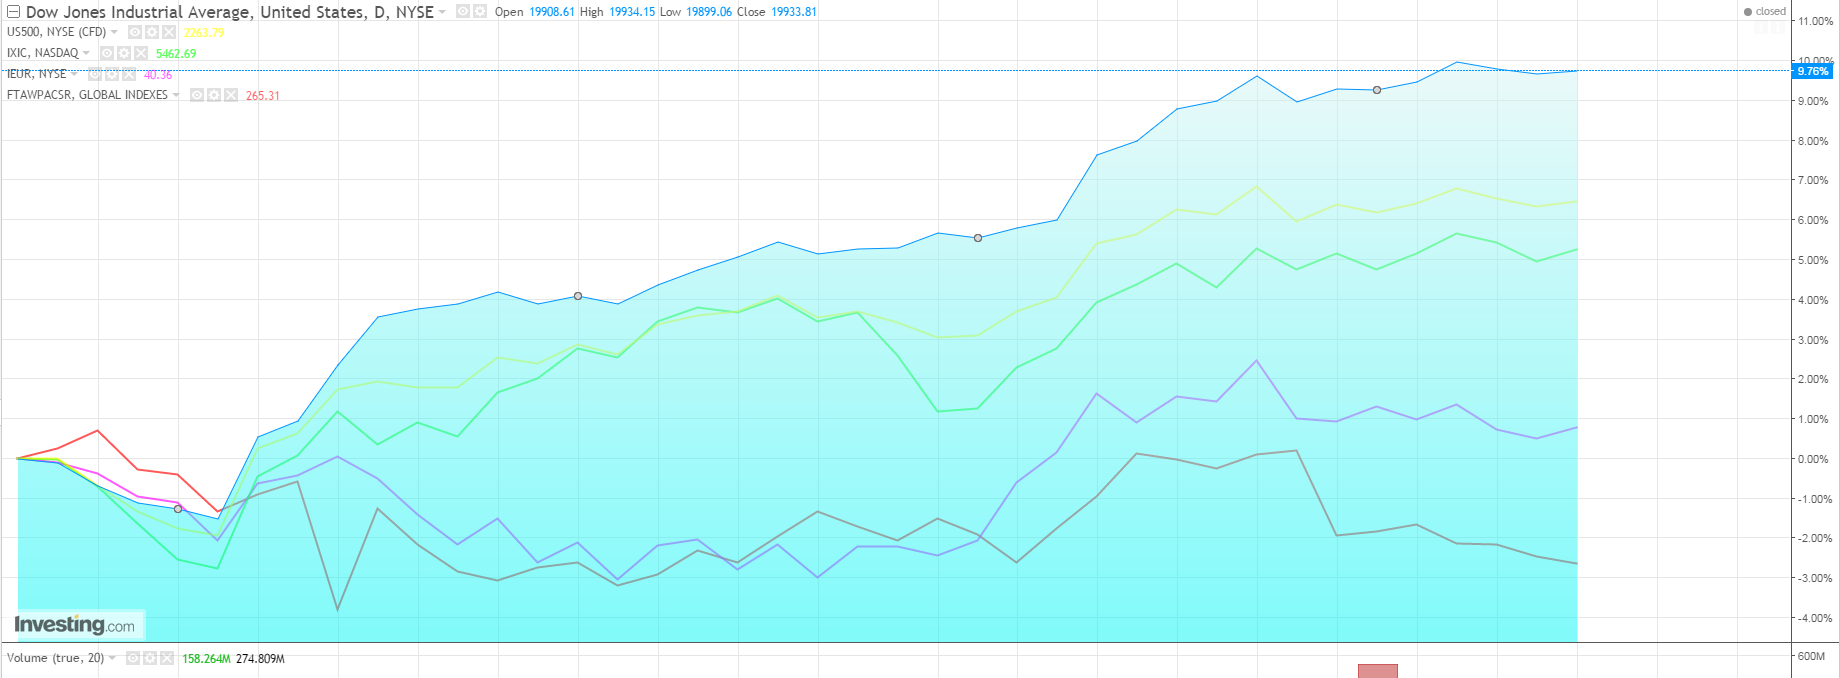
Overnight in Asia, however, major indices were up: the Shanghai Composite rose 0.17% to 3,115.33, while the Nikkei edged 0.03% higher, to 19,403.06. The Hang Seng was closed for Christmas.
European markets have fluctuated within a small, two percent range for the past two weeks. In early trading, the DAX is up 0.16% to 11,468.50 while the Stoxx 50 is 0.09% higher, at 3,277. The FTSE is closed until tomorrow.
US markets have been the most tightly range-bound for the past two weeks, with the Dow, NASDAQ, and S&P 500 all within an approximate span of +/- one percent. That doesn’t appear to be changing today. In pre-market trading, the S&P is up just 0.01% while the NASDAQ is up 0.02%. The Dow is 0.03% lower.
US Treasury yields moved sideways last week in narrow ranges as well. Yield for the 2-year bond note is currently at 1.218%; the 10-year yield is at 2.553%; and the 30-year yield is 3.132%. With the yield arrow currently pointing up for all three of these Treasury Bonds, technical indicators (chart below) favor additional near-term increases. The 2-year note especially is currently at levels previously seen in 2008.
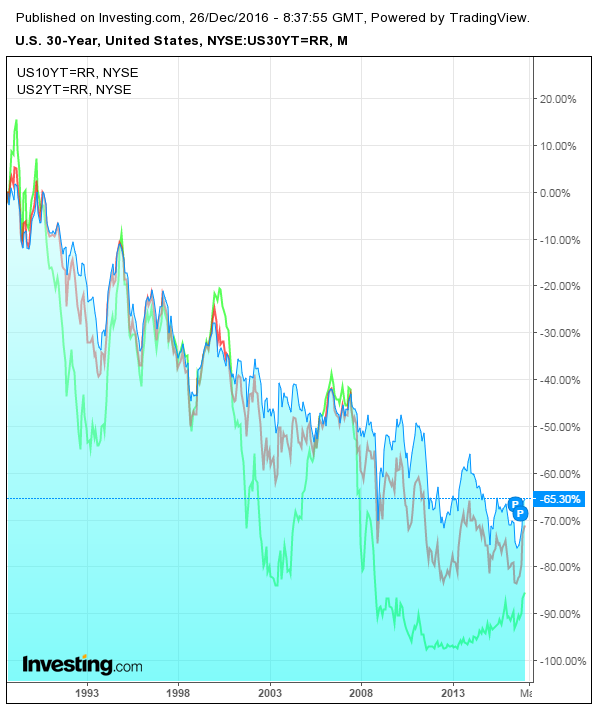
Despite the recent uptick, bond yields are still at historically low levels.
Forex
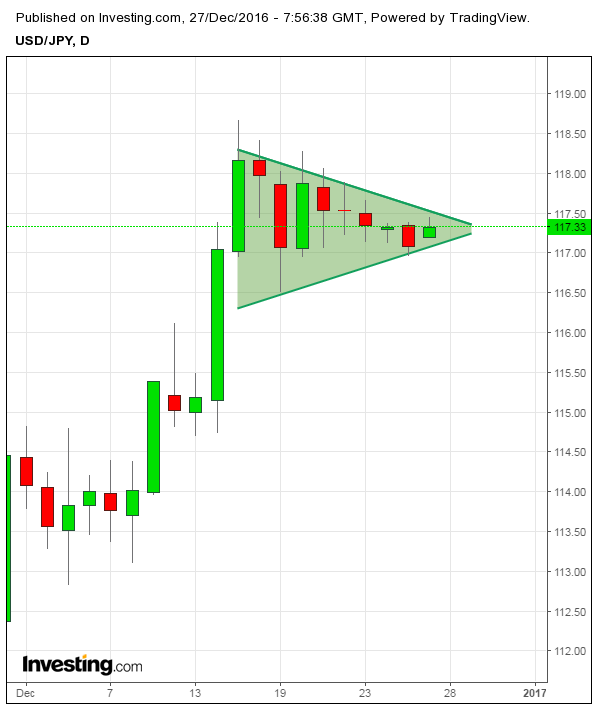
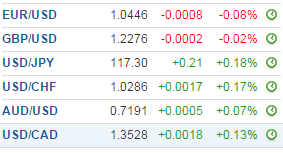
Much like the equity markets, currency trading has also tailed off during the holiday period. The range for USD/JPY has grown smaller with each passing day. The pair is currently trading at 117.30.
Once this period of consolidation ends, the US dollar will likely resume its bullish trajectory versus the yen and move towards 118 again.
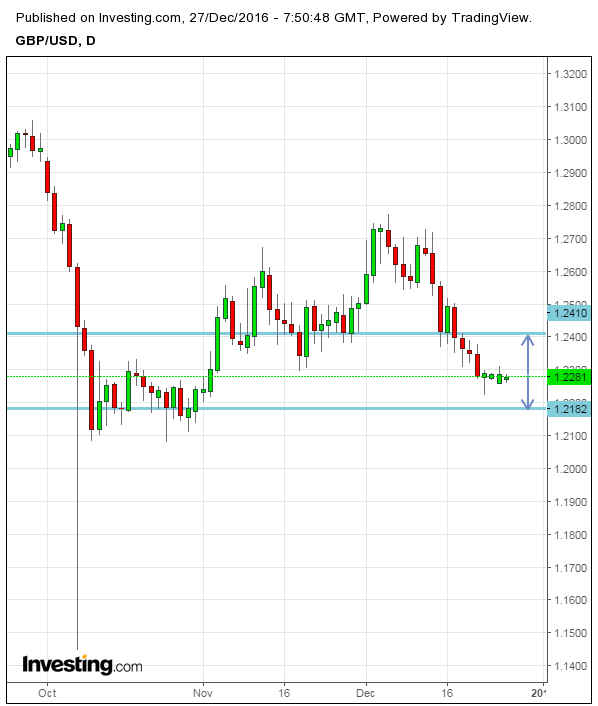
The British pound has been struggling since the Fed raised rates. Currently at $1.2276, it could fall further still when its current consolidation phase completes. The next downside target is $1.2182; upside target is $1.241.
The euro has weakened yet more since the US election; it's fallen off approximately six-and-a-half cents. Divergent monetary policy should continue to weigh on the single currency.
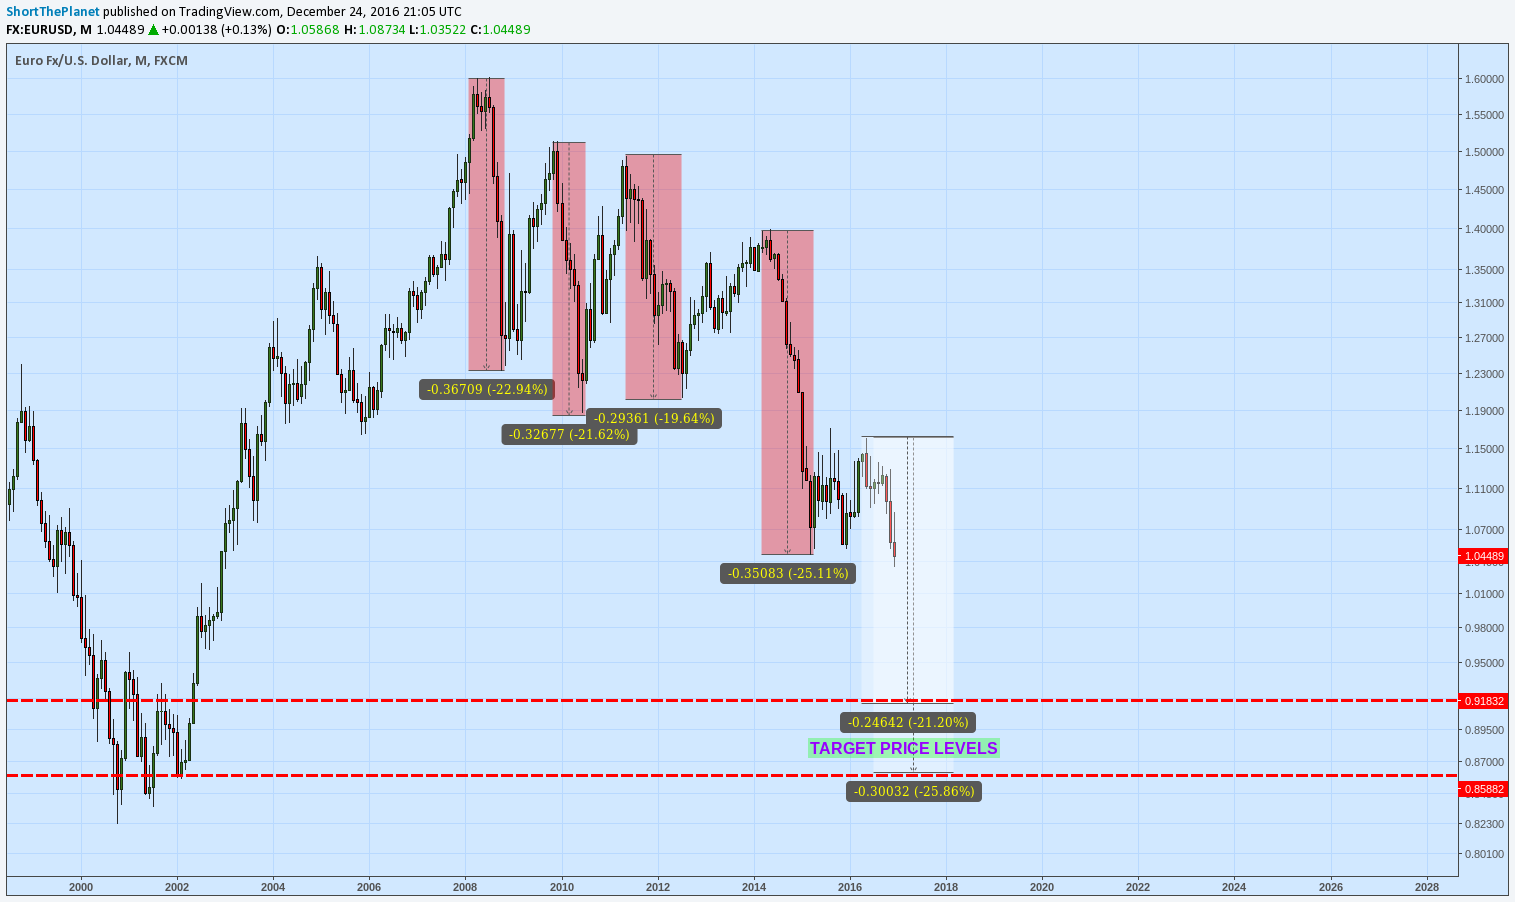
Much like the yen and GBP, once FX trading picks up after the holidays, more downward movement for the EUR is likely. Many analysts expect EUR/USD to reach parity, possibly as early as the beginning of next year. One analyst even makes the case for a lower low. Indeed, with most EUR/USD crashes since 2008 experiencing 20%-25% declines, a downside correction from the most recent high of $1.16 would land the euro squarely in the $0.85-$0.95 area.
Thus far today, the dollar has made small gains against a basket of currencies. The US Dollar Index currently sits at 103.02.
Amongst the major currencies today, only the Aussie has gained against the greenback, as of this writing.
Commodities
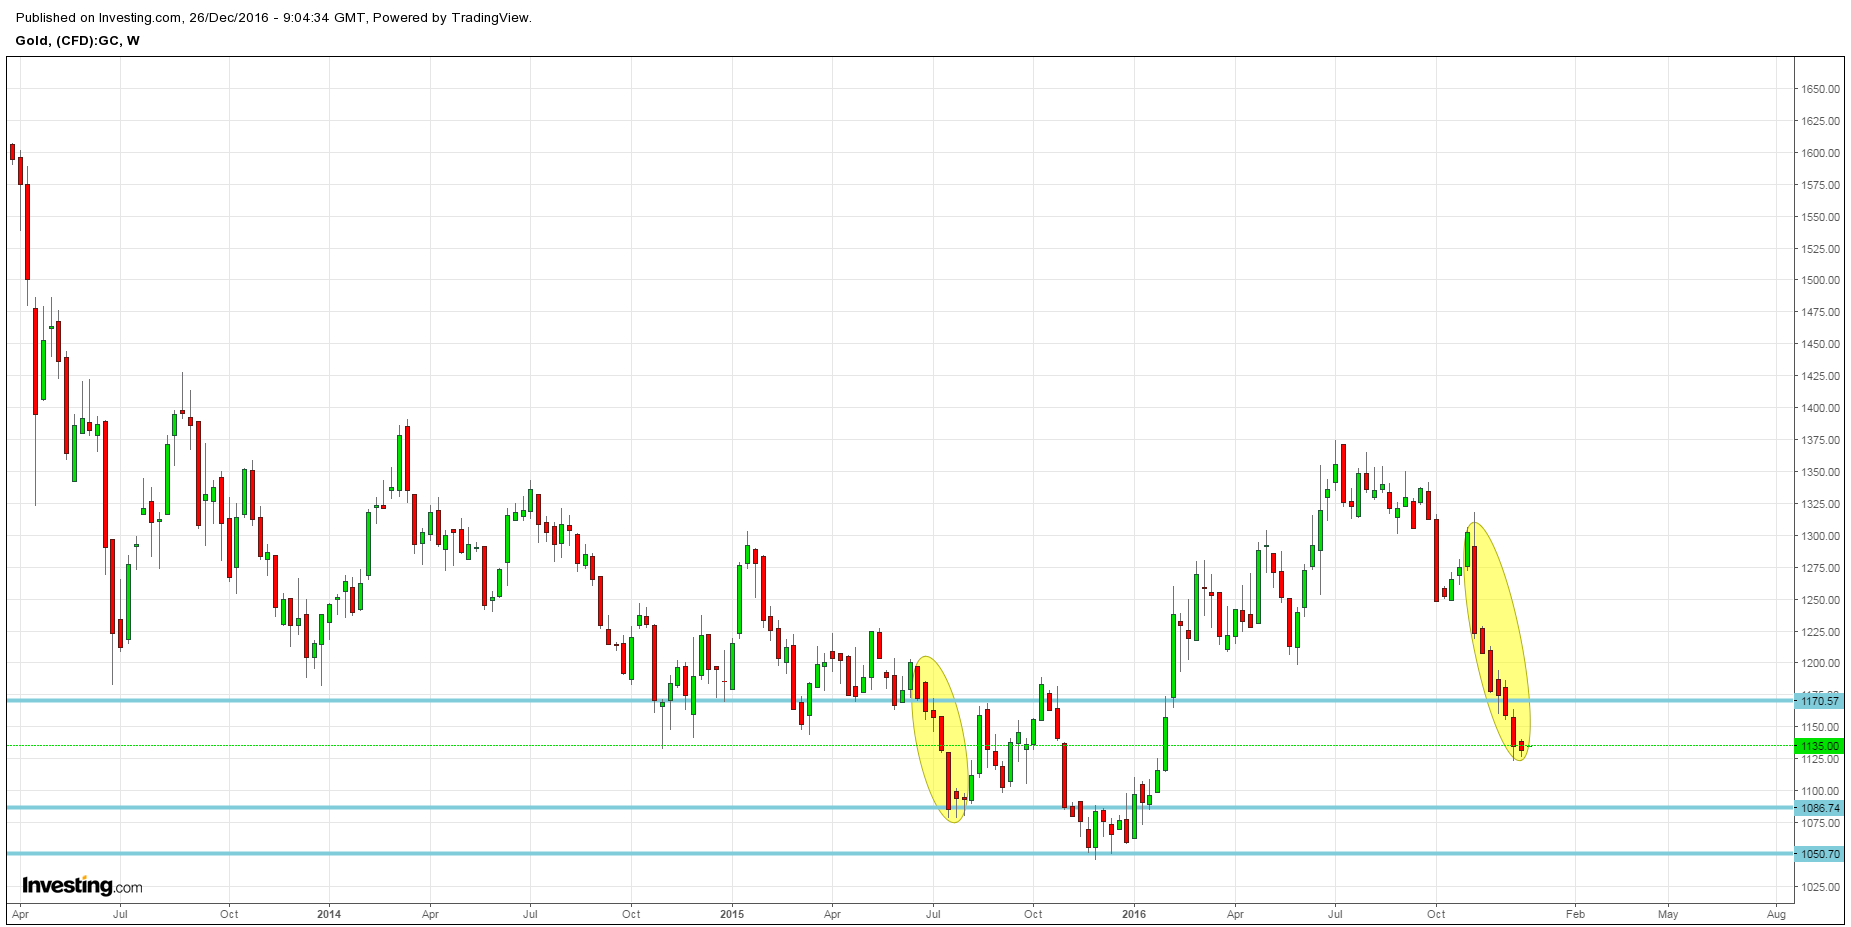
Gold is up one percent this morning, to $1,145.45. However, it’s been in a straight downward decline for the past seven weeks straight.
The precious metal has endured seven consecutive, bearish weeks previously—the last time from June 22-August 3, 2015—when prices were approximately $1,090/ounce. This current bearish downleg, however, is unique in that each week the yellow metal experienced a lower close than the week before. At this point, a move toward $1,080-$1,050 is not out of the question. An upside move could see gold rise to $1,170.
Oil is currently trading at $53.35, a level not seen since July, 2015. Brent is up, trading at $56.10.
Last month, for the first time in eight years, OPEC actually behaved like a cartel, and promised to cut oil production by 1.2 billion bpd. Selected non-OPEC nations joined the agreement several days later. The deal is slated to take effect at the beginning of the New Year and extend through the first half of 2017. If the nations that agreed to the deal can actually comply by limiting production, this arrangement could potentially keep oil prices buoyed until the US's summer driving season—the peak demand period for the commodity.
On occasion markets will react to breaking news, particularly when it relates to oil, but traders appear to be unfazed by the latest out of Russia, where yesterday it was announced that a 2017 production increase should be expected. As Russian Deputy Energy Minister Kirill Molodtsov said:
“Supposedly 253.5 [million tons of oil are expected to be exported from Russia] this year, which is 4.8 percent more than in 2015. In 2017, we will have a little more than this.”
Stocks
On Sunday we covered weekly sector performance, as well as the biggest gainers and losers on the S&P. In this post we'll focus just on Friday’s close. The S&P gained 0.11% on the day, rising to 2,263.79, but Health Care companies were the real winners, led by the biotechnology sector which jumped 1.08%.
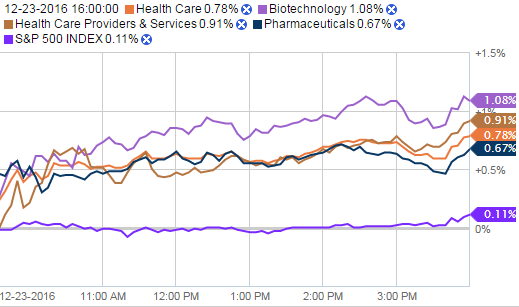
Source: Fidelity.com
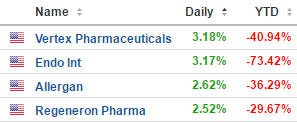
The biggest gainers within the sector were Vertex Pharmaceuticals (NASDAQ:VRTX) and Endo International (NASDAQ:ENDP) which both jumped approximately 3.18%, followed by Allergan (NYSE:AGN) which rose 2.62%, and Regeneron (NASDAQ:REGN), which finished the day up 2.52%.
Still, none of these stocks had a good 2016. YTD, Regeneron has fallen 30%; Allergan has dropped 36%; Vertex is down 15.34%; and Endo has plummeted more than 73% – the biggest decline of any company in the Health Care index.
Merck & Co (NYSE:MRK) was the only Health Care stock that fell on Friday, edging 0.03% lower, to $59.56. Ironically, in contrast to Friday's Health Care gainers listed above, Merck is actually up 12.76% year-to-date.
