Stocks found their footing after the promise of more stimulus compounded dip buying following the worst week for equities since the financial crisis. However, yields were still lower. The euro strengthened against the dollar, which gained against the yen. Gold rebounded, and oil bounced.
All four main U.S. futures rebounded from important support area as we forecast yesterday.
The STOXX Europe 600 Index bounced with all its 19 industry sectors, as dip buyers were emboldened after the Federal Reserve allowed for the possibility a rate reduction, because of the aptly characterized “evolving risks” of the virus.
Asian markets provided investors with a heart-stopping roller coaster ride. First, they extended losses over 1%, only to come into gains. Australia’s ASX 200 was down 3% before it pared the rout to 0.7 percent. All it took was seven days of losses to wipe out nine months of gains to the value of 10.75%.
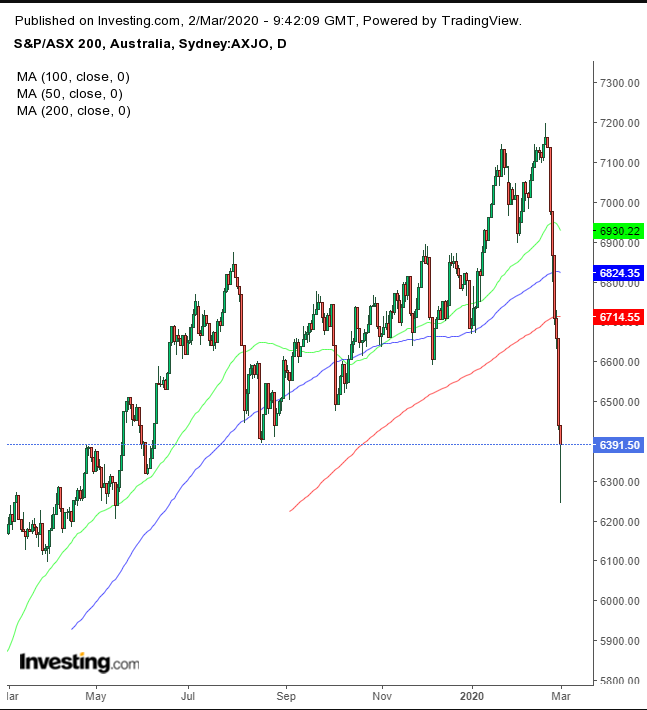
Technically, the price produced a powerful hammer, the closing price of which coincides with the August lows.
Machiavellian Economics
Ironically, China’s Shanghai Composite, the leading index of the country where the coronavirus originated, opened higher and closed 3.15% higher — something that seems mind-boggling in the current environment.
This cognitive dissonance intensifies when the performance is compared to China's neighbors. South Korea’s KOSPI has tumbled 12% since its January high, Japan’s Nikkei 225 dropped 11.4% in the same period, Australia’s ASX shed 10.5% from its January high, Hong Kong’s Hang Seng 9.7% — while China’s Shanghai Composite retreated only 4.6% in the same time.
How to explain this dichotomy? Machiavellian economics. China throws money at any problem, while not being overly sensitive about human capital.
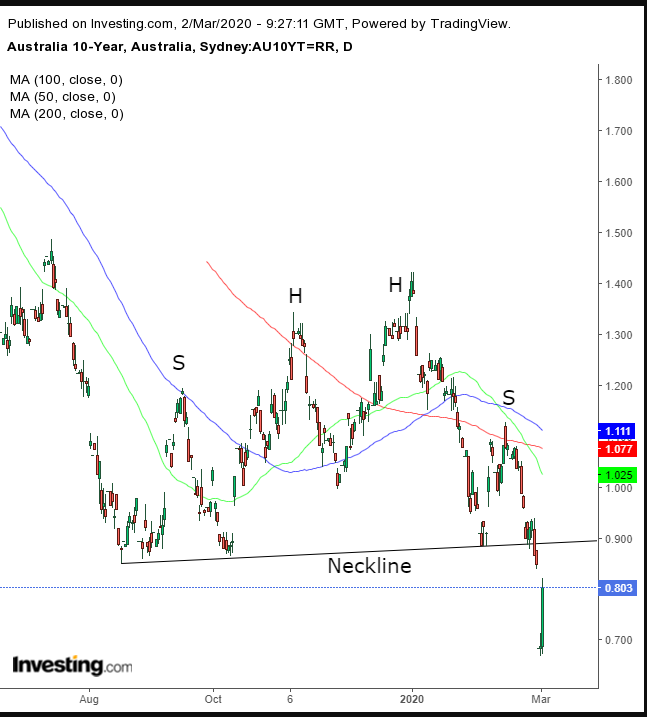
Australia and New Zealand yields joined those of the U.S. in record lows. In the chart, we can see a completed Complex H&S Continuation pattern, followed by a return move.
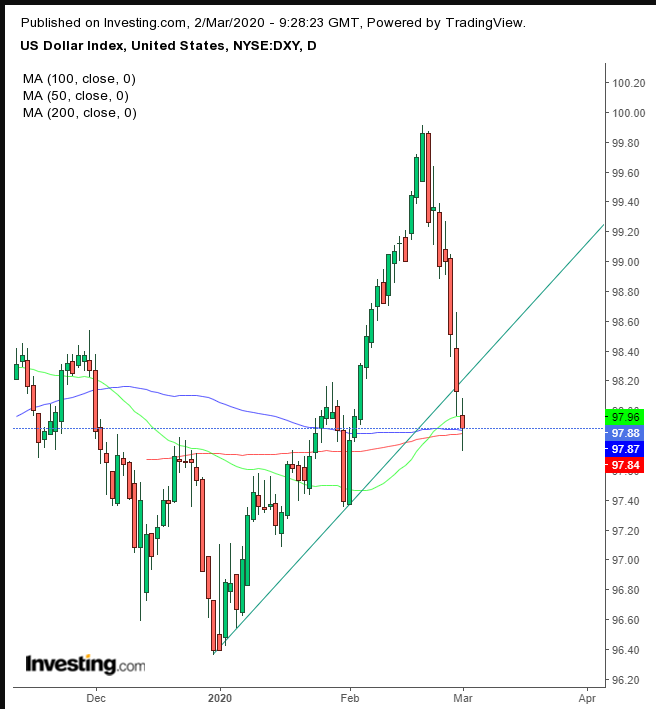
The dollar extended a rout, falling below an uptrend line since the beginning of the year, as well as below the 200 DMA.
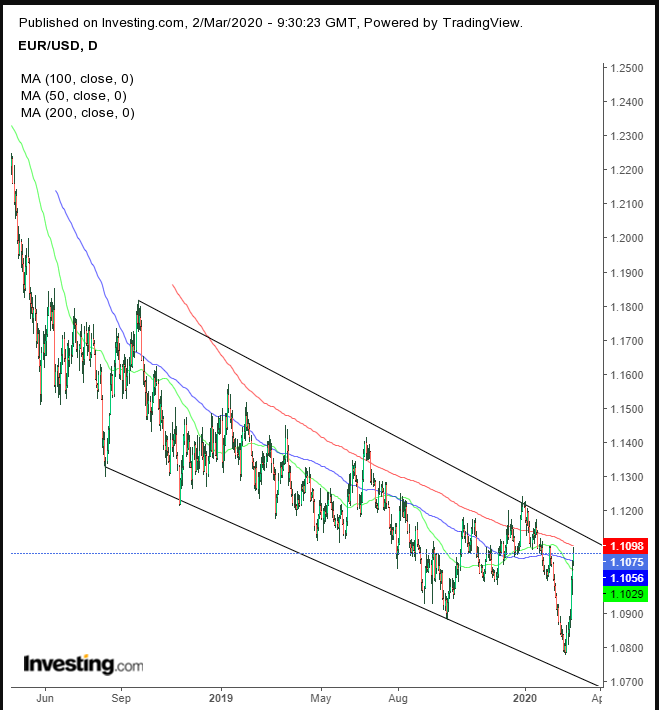
The euro pushed the dollar down, climbing for the sixth day, after the Fed signaled a potential rate cute. Technically, however, the euro simply made a return move toward its channel top and the 200 DMA that guards it.
Initially the dollar still strengthened against the yen, after the BOJ joined the Fed in pledging to act against the virus risks. However, its haven status gave yen bulls a push, forcing the USD/JPY below the 200 DMA and holding onto the thread of the January lows.
Bitcoin traded for the fourth day below its 200 DMA.
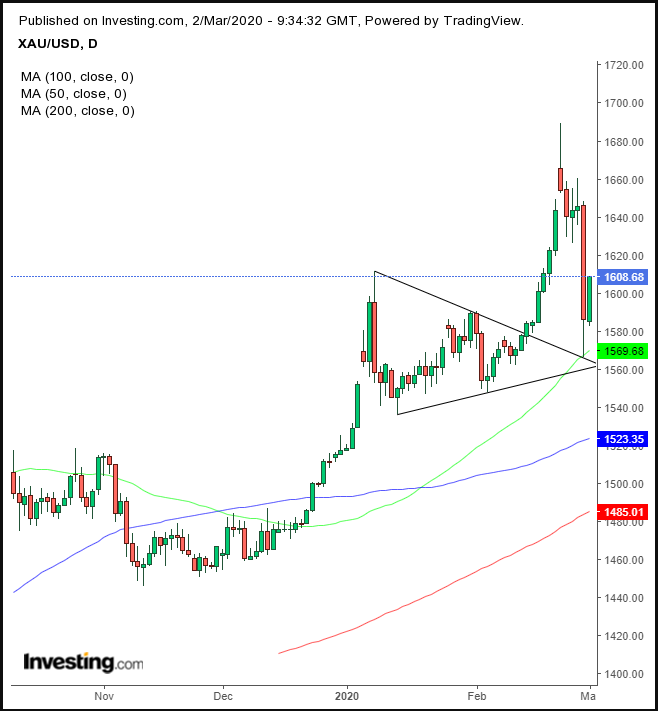
Gold rebounded after resetting yesterday a continuation pattern, bouncing off its top.
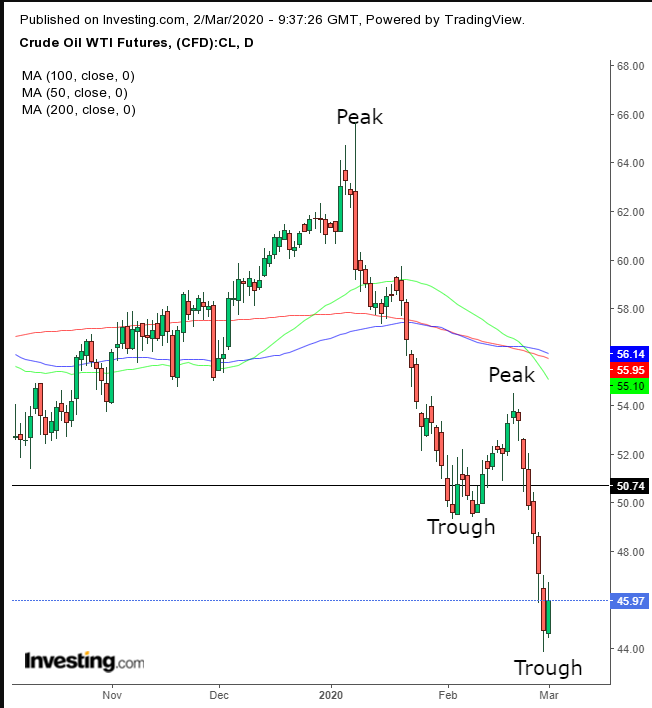
Oil rebounded toward $46 but the cards are stacked against it, after it completed a descending series of peaks and troughs. Having said that, we can’t write off a corrective move toward $50.
Up Ahead
- A key factory gauge on Monday is projected to show that U.S. manufacturing came close to stagnating last month. The ISM purchasing managers index is estimated to fall to 50.5 from 50.9.
- The Reserve Bank of Australia sets policy on Tuesday.
- The Bank of Canada has a rate decision on Wednesday.
Market Moves
Stocks
- The Stoxx Europe 600 Index surged 2%.
- S&P 500 on the S&P 500 Index jumped 2%.
- Nasdaq 100 Index futures advanced 2.2%.
- The U.K.’s FTSE 100 Index jumped 2.8%.
- The MSCI Asia Pacific Index climbed 0.9%.
Currencies
Bonds
- The yield on 10-year Treasuries decreased two basis points to 1.13%.
- The yield on 2-year Treasuries dipped 12 basis points to 0.79%.
- Germany’s 10-year yield advanced one basis point to -0.60%.
- Australia’s 10-year yield fell one basis point to 0.808%.
