Wednesday January 11: Five things the markets are talking about
Will PEOTUS take an aggressive line in his first news conference since his surprise U.S Presidential win eight-weeks ago on issues such as trade policy and relations with China or will he stick to a script?
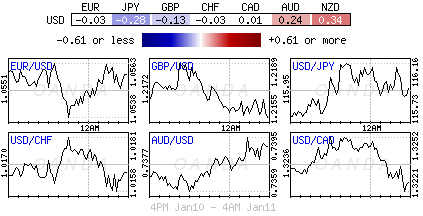
The dollar has recovered somewhat from its deeper losses recorded yesterday, on the view that the market has over-reacted to worries about U.S. President-elect first news conference this morning at 11:00 am EST.
Even the World Bank has given two thumbs up to Trump. The bank believes that tax cuts planned by the U.S President-elect could jump-start the U.S economy and give a boost to growth around the world. In their latest update of economic trends, the bank has left forecast for U.S growth unchanged at +2.2% and +2.1% for 2017 and 2018; stating that the economic stimulus may be squandered if Trump also starts a trade war with consequential bilateral tariffs or barriers.
1. Global equities get a boost from regional data
Asian indexes broadly rose overnight on encouraging economic data and on todays Trump press conference which traders hope may contain details of his stimulus program.
With inflation coming back globally would suggest that demand is returning to world economics.
The dollar-denominated MSCI AC Asia Pacific climbed +0.4%, with raw-material stocks up +1.9% and Japan’s Topix index rallying +0.5%. Miners and technology shares led Aussies ASX 200 Index up +0.2%, while Kiwi stocks climbed for a third consecutive day.
Note: Australian job vacancies rose +2.2% to +182k in the quarter through November.
Elsewhere, the Shanghai Composite Index fell -0.8%, the Hong Kong’s Hang Seng Composite Index rose +0.8% – its tenth consecutive gain, while the Hang Seng China Enterprises Index added +0.7%.
In Europe, equity indices are trading mixed ahead of the U.S open. Currently, there are no notable sector drivers in the Eurostoxx, while financials and mining stocks are mixed on the FTSE 100.
U.S futures are set to open in the black.
Indices: Stoxx50 +0.1% at 3,311, FTSE +0.2% at 7,288, DAX +0.2% at 11,607, CAC 40 +0.2% at 4,896, IBEX 35 -0.2% at 9,436, FTSE MIB +0.2% at 19,458, SMI +0.1% at 8,458, S&P 500 Futures +0.1%

2. Oil prices rise on Saudi production details, safe haven gold higher
Oil prices have rallied overnight for the first time in three-days on news of the Saudi supply cuts to Asia.
Nevertheless, persistent doubts over output reductions and signs of rising shipments from other producers are expected to limit future oil price gains.
Brent futures are up +52c at +$54.16 a barrel, while U.S. West Texas Intermediate crude futures have rallied +44c to +$51.26 a barrel.
Saudi Arabia, the world’s top oil exporter, has told some of its Asian customers that it will reduce their crude supplies slightly next month. However, any initiative like this is expected to be offset by other producers.
For instance, Iraq plans to raise crude exports from its southern port of Basra to an all-time high in February. The country’s State Oil Marketing Company (SOMO) plans to export +3.641m bpd, potentially beating a record of +3.51m bpd set last month.
Traders will look to today’s weekly U.S EIA report for direction (10:30 am EST).
Gold as a safe haven continues to cash in on fears around Brexit and Trump.
The precious metal futures traded up +0.3% to +$1,188.40 per ounce overnight, atop of its one month highs as the dollar dipped ahead of today’s news conference by U.S. President-elect Trump (11 am EST, NY). The market prefers to look for more clues on Trump’s spending plans in his first speech since his election win in November.
Also providing support, a modest demand for “physical” gold from emerging markets, in particular China and India, is providing the precious metal support on pullbacks.

3. Sovereign yield curves flatten
Since Trump’s surprise election win, global bonds have lost over -$1T in value on expectations for higher rates. The benchmark U.S. 10-Year yield has spiked from +1.60% to +2.35% in next to no time.
U.S fixed income data this week shows that Hedge funds and money managers hold a net -$94.3B ‘short’ in Treasury futures contracts betting on a rise in U.S bond yields for the week that ended Jan 3 – its the largest ‘short’ position in nearly nine-years. The amount has soared from -$42.2B for the week that ended on the U.S Election Day.
The higher yield momentum has been pulling back after U.S 10’s closed at +2.6% in mid-December. The current 10’s are trading at +2.388% ahead of this morning’s open. Any surprises on Trump’s economic policies and U.S spreads are expected to tighten.
Elsewhere, Aussie government bond yields backed up +2bps to +2.73% after losing -5bps, or -0.06% in the previous session. Similar Kiwi maturities are yielding +3.18%, up +1bps.

4. Pound pummeled on data, TRY looking for CB support
The EUR (€1.0518) is slightly lower in somewhat quiet overnight trading. It seems that dealers are taking note of the higher level of Eonia (the one-day interbank interest rate for the Eurozone) and are not too convinced about the ECB’s pledge to keep rates low beyond the end of QE.
The pound has extended its fall with GBP/USD down -0.6% at £1.2116 and EUR/GBP up +0.3% at €0.8694, after U.K. data this morning showed industrial production (IP) rising more than forecast (+2.1% vs. +0.8%), but the trade deficit (-£12.2B) widening more than expected.
Note: Sterling 10-week low is £1.2107 print yesterday.
The TRY ($3.8600) has hit another fresh record low against the USD. Dealers continue to speculate whether the Turkish Central bank would defy government warnings of hiking interest rates.
Note: TRY is already down over -7% this month.
5. Banxico reserves depleted after intervention
According to the latest reserve report from the central Bank of Mexico (Banxico), authorities sold $2B last week in its first foreign-exchange interventions in nearly 12-months. Reserves fell by -$1.8B during the week to +$174.7B.
Investors continue to flee Mexico’s financial markets, sending the MXN to record lows on mounting concerns that Trump’s trade policy could end the country’s “privileged” status. The MXN ($21.78) slumped -2% yesterday and is opening atop of its record low outright.
Despite the CB intervening on a number of days (even during an illiquid Asian session where they expected to get the best “bounce” for the buck) the MXN has remained under pressure – MXN$21.7980